Lines of Code Changed
This panel focuses on Number of lines of code changed. We based the panel on Git data.
The idea behind the panel is having a look on how community contributes to the repositories by having a look at the magnitude of those changes with several metrics related with Git commits, specially modified lines and the amount of affected files. By using this panel we can identify and analyze behaviors of specific organizations, projects or repositories.
There are some filters added by default for the whole panel:
NOT Merges: It ignores those commits whose number of modified files is 0 (this is, commits from merges).NOT Bots: It ignores those commits whose author is marked as a Bot.
What should I look for in the panel?
If in this panel we observe a given project or repository in an early stage, we expect to observe a higher number of modified lines (presumably, more added lines than removed) in a narrower time-range. That would correspond with high peaks in the Evolution of lines added vs lines removed chart.
If that project has became stable, the expected number of modified lines will be smaller than before, but keeping in mind the value wouldn’t vary drastically except for events such code refactoring or major updates.
If we are looking at a project in close to its final days, we expect the number of modified lines would decrease significantly, and we would not observe high peaks even considering wider time-ranges.
List of metrics provided on the panel
- Number of authors: number of authors who modified at least one file within the selected time-frame.
- Median modified files: Median amount of files changed (at least one line added or removed) per commit in a given time-frame.
- Number of added lines: Amount of new lines in all commits from a given time-frame.
- Number of removed lines: Amount of deleted lines in all commits from a given time-frame.
- Evolution of lines added vs lines removed: evolution of number of added/removed lines during the selected time range.
- Evolution of commits: evolution of number of commits during the selected time range, per project.
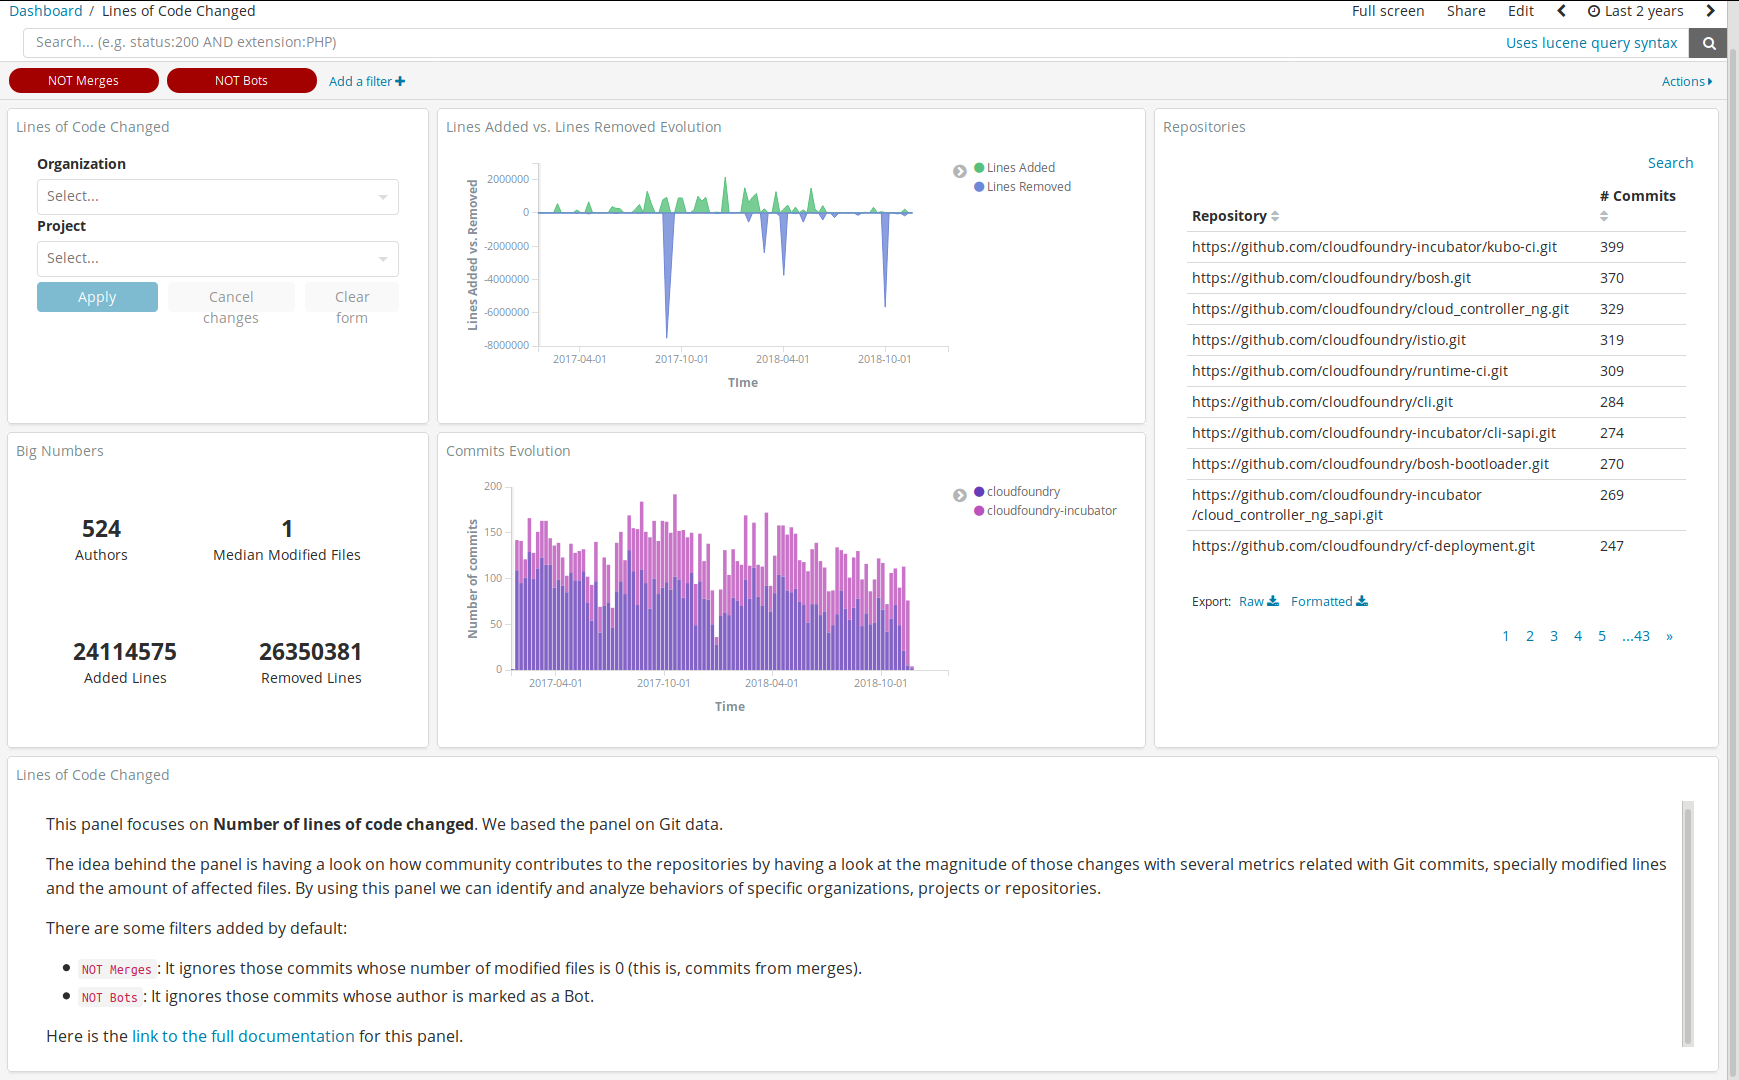
Filtering by Organization and Project is allowed by using the top left corner widget.
Number of authors, Median modified files, Number of added lines and Number of removed lines are shown below the filtering widget. These are global numbers to have an idea about the amount of data we are visualizing with current filters. The number of commits per repository is shown at the right hand side, within repositories table.
Evolution of lines added vs lines removed is almost centered in the panel, between the filter widget and repositories table. It shows an area graph showing the amount of added lines above the X-axis and the amount of removed lines below the X-axis, from the commits within period selected in time picker, on the top right corner.
Evolution of commits is below the last graph, between the big numbers widget and repositories table. It shows bar chart where each bar represents the amount of commits in a given time (depending on the granularity of the graph it could be hours, days, weeks, months, etc.). Each bar is split by project.
Finally, a short text is shown at the bottom to explain the basics needed to understand the panel and its filters.
How to import this panel into your GrimoireLab instance
Please follow instructions at the Contributing file in the Sigils repository.
Files
To use this dashboard with your own GrimoireLab deployment you need to:
- Check
gitindex is available on your GrimoireLab instance (see grimoirelab-sirmordred documentation for details on how to deploy it). - Import the following JSON files using Kidash tool.
| Index Pattern | —– | Dashboard |
Command line instructions
Once you have the data in place, if you need to manually upload the dashboard execute the following commands:
kidash -e https://user:pass@localhost:443/data --import git-index-pattern.json
kidash -e https://user:pass@localhost:443/data --import lines_of_code_changed.json
Edit this doc