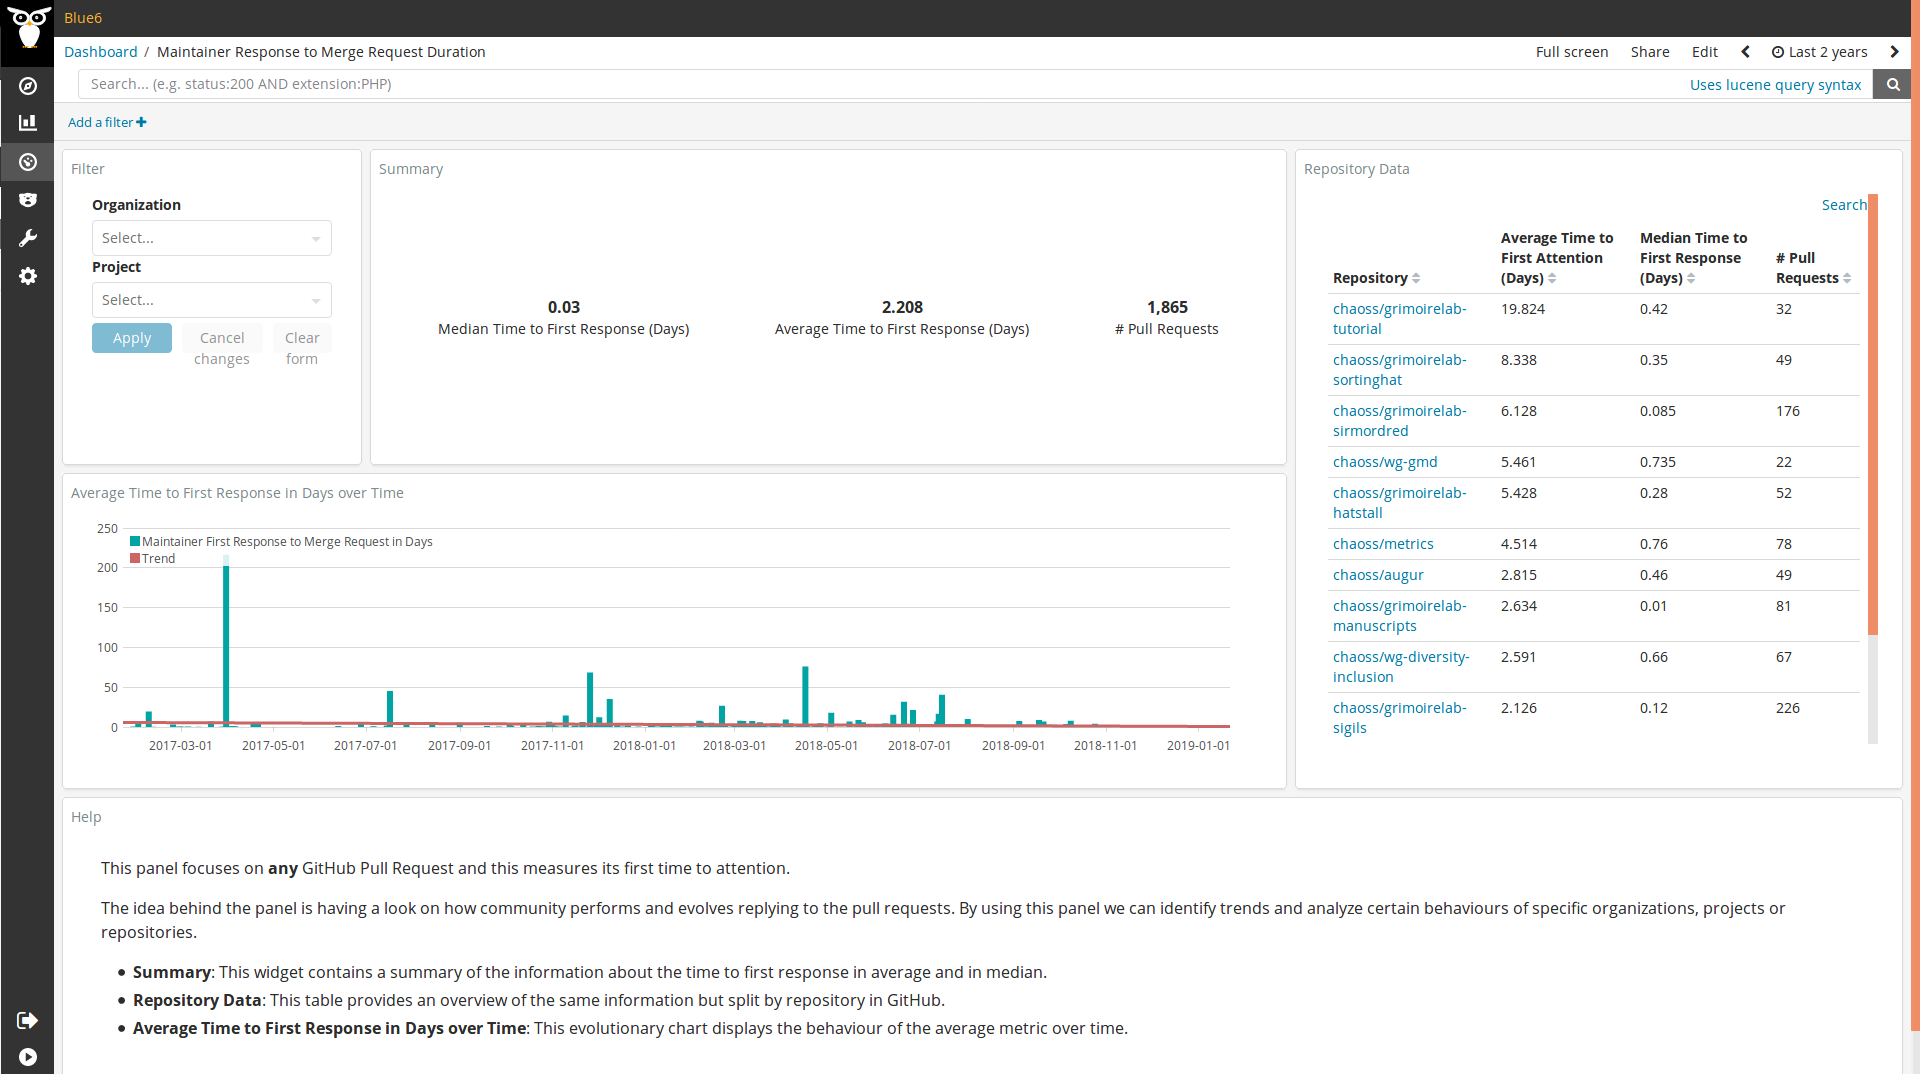
Maintainer Response to Merge Request Duration.
This panel provides information about the time to first response to a pull request.
The goal of this panel is to provide several data access layers (organizations, projects and repositories) and play with the time to first response using the average and the median as main metrics.
Widgets and metrics provided in the panel
- Summary: number of pull requests submitted and their time to first attention in average and in median.
-
Average Time to First Response in Days over time: evolution of the average time to response a pull request. This chart aggregates the information by the date of creation of the pull request. Thus, each of the columns displayed in the chart shows the average of the first time to response of all of the pull requests opened in such timeslot.
- Repository Data: this widgets displays information about the time to response in average and in median per repository. This provides the number of pull requests per respository as well.
Filtering by Organization and Project is allowed by using the top left corner widget.
Finally, a short text is shown at the bottom to explain the basics needed to understand the panel.
Files
To use this dashboard with your own GrimoireLab deployment you need to:
- Check
github_issuesindex is available on your GrimoireLab instance (see grimoirelab-sirmordred documentation for details on how to deploy it). - Import the following JSON files using Kidash tool.
| Index Pattern | —– | Dashboard |
Command line instructions
Once you have the data in place, if you need to manually upload the dashboard execute the following commands:
kidash -e https://user:pass@localhost:443/data --import github_issues-index-pattern.json
kidash -e https://user:pass@localhost:443/data --import maintainer_response_to_merge_request_duration.json

Edit this doc