Attracted Contributors
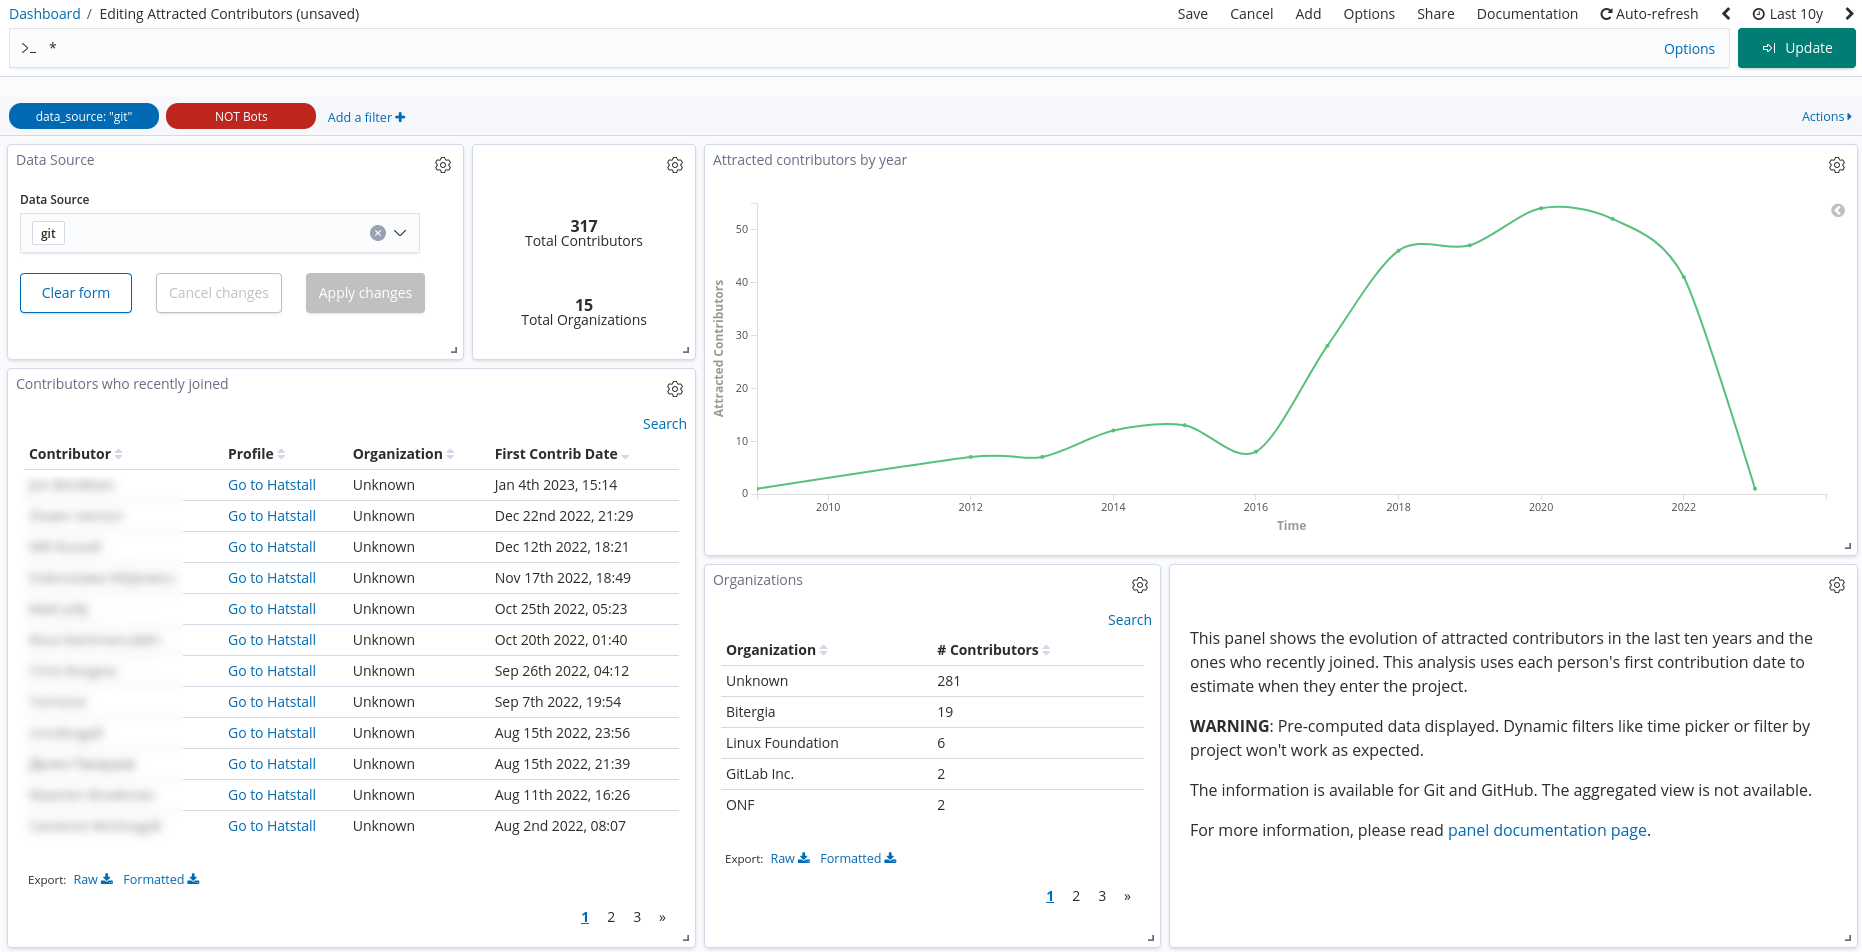
This panel shows the evolution of attracted contributors in the last ten years and the ones who recently joined. This analysis uses each person’s first contribution date to estimate when they enter the project.
This panel is intended to be used with the whole history of the community activated and not with some pre-established activity timeframe as in other panels (for instance, 2 years). This is done this way as the information pre-calculated and displayed focuses on the first contribution of each new member.
The drop-down menu on the top left side allows you to switch from Git to GitHub data sets,
as a unified view is unavailable. Next to it is a small table with a summary of the number
of total contributors that joined the project and the number of total organizations those
newcomers belong to. On the left side, we can find a table with a list of newcomers, with
a link to the SortingHat profile, the name of the organization they belong to, and the date
of the first contribution. That table is sorted in reverse order, so newer members appear
on top. The main chart is a line chart that shows the number of attracted contributors per
year. The line is smoothed, and the metric calculates the unique values of the
field author_uuid. Underneath the line chart, there is a table and a helping text. The
table shows a list of organizations and their number of contributors.
Due to how data is pre-calculated, it is impossible to filter by organization, project, or repository and get an accurate value. For example, if we filter by organization, we will only find the members who started contributing from that company. Let’s imagine ten new contributors joined the project working for Bitergia in 2019. A year later, they were hired by Google to keep working on the same projects. As a result, those ten contributors would appear associated with Bitergia in this dashboard and never to Google.
There is a known issue that may affect the readability of the panel: When a developer is detected as committing her first piece of code in 1970. This issue is caused by the information offered by the Git repository and the cleaning process of the Grimoirelab enrichment. This data issue provokes that the information for such developer for her first commit took place in 1970, which is clearly wrong. Those commits should be ignored or updated to an actual activity timeframe at some point. If you see this behavior in the dashboard, please report this as a bug.
Files
To use this dashboard with your own GrimoireLab deployment you need to:
- Check
demographicsindex is available on your GrimoireLab instance (grimoirelab-elk automatically creates this alias for you when the corresponding study is set to active in grimoirelab-sirmordred). - Import the following JSON files using Kidash tool.
| Index Pattern | —– | Dashboard |
Command line instructions
Once you have the data in place, if you need to manually upload the dashboard execute the following commands:
kidash -e https://user:pass@localhost:443/data --import demographics-index-pattern.json
kidash -e https://user:pass@localhost:443/data --import attracted-contributors.json

Edit this doc