Bugzilla
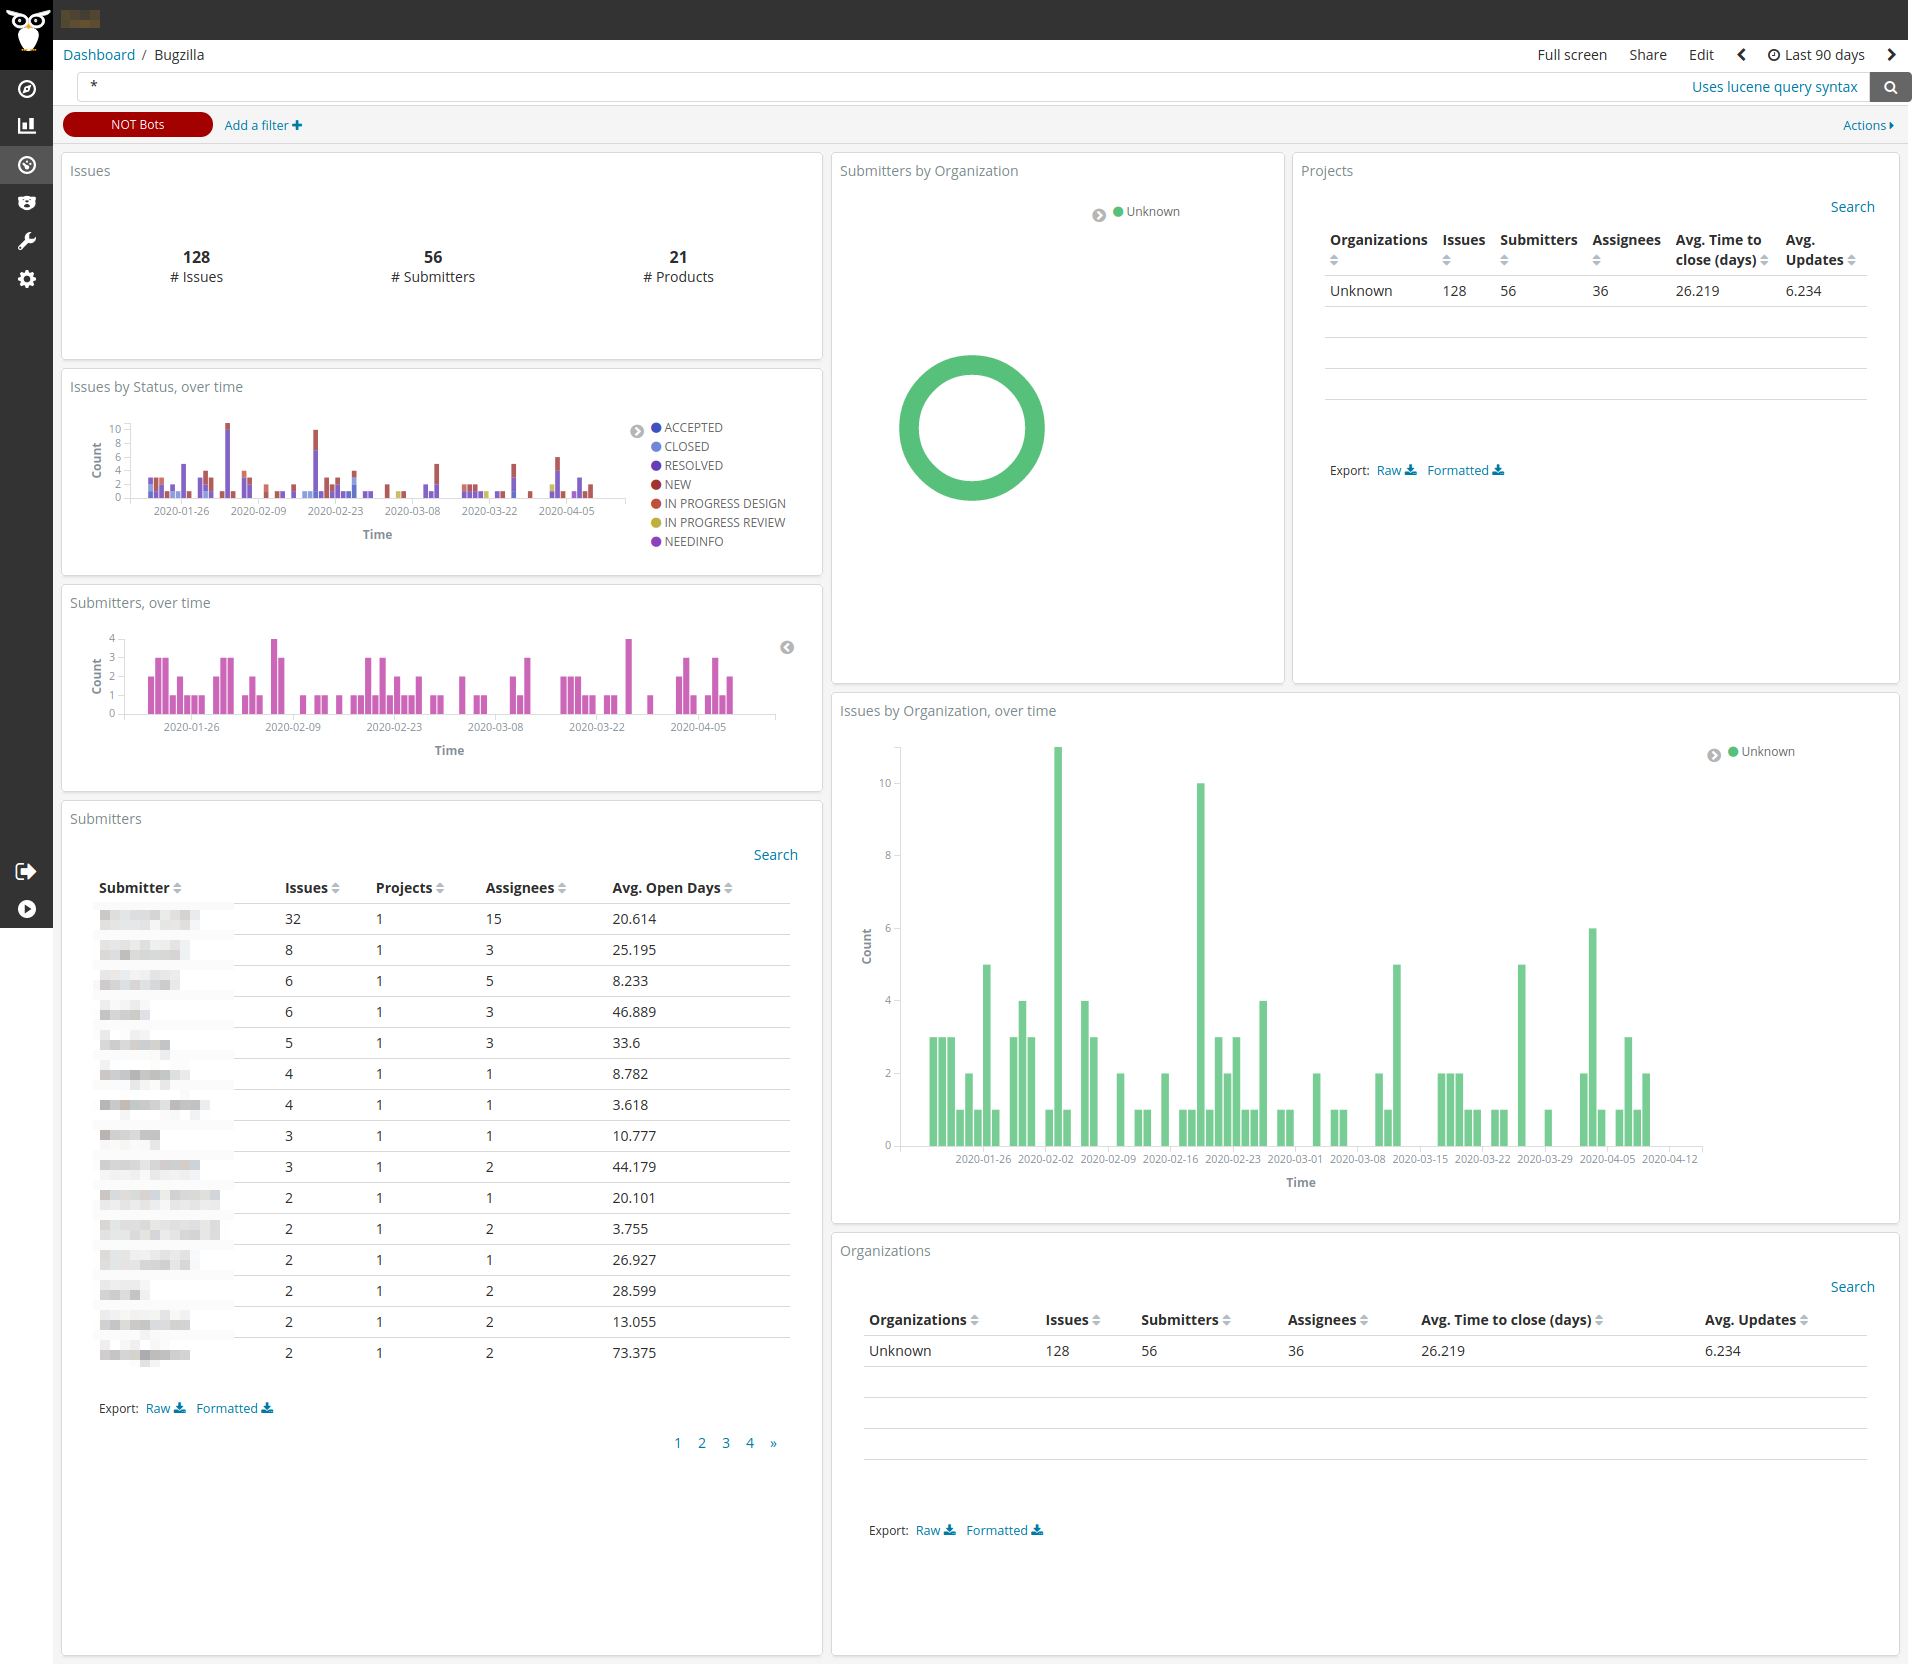
This dashboard contains information about submitters, products, and status of the issues.
These panels show activity by products and status of the issues. Each issue has a creation date and statuses. We measure activity based on the amount of bugs created over time and their statuses.
This way, we can filter to get activity information related to a given submitter, products or/and status of the issues.
Metrics
The metrics provided are:
- Issues: total numbers of issues, submitters, and products.
- Issues by Status, over time: a bar chart that shows the evolution of the status of the issues over time.
- Submitters by Organization: a pie chart that summarizes the issues by the submitters’ organization.
- Projects: a table sorted by projects that details the number of issues, submitters, assignees, the average time to close the issue (days), and the average time to update the issues.
- Submitters, over time: a bar chart that shows the evolution of the number of submitters over time.
- Issues by Organization, over time: a bar chart that summarizes the issues by the submitters’ organization.
- Submitters: a table sorted by submitters that details the number of issues, projects, assignees, and the average time the issues have been open (days).
- Organizations: a table sorted by organizations that details the number of issues, submitters, assignees, the average time to close the issue (days), and the average time to update the issues.
Files
To use this dashboard with your own GrimoireLab deployment you need to:
- Check
bugzillaindex is available on your GrimoireLab instance (see grimoirelab-sirmordred documentation for details on how to deploy it). - Import the following JSON files using Kidash tool.
| Index Pattern | —– | Dashboard |
Command line instructions
Once you have the data in place, if you need to manually upload the dashboard execute the following commands:
kidash -e https://user:pass@localhost:443/data --import bugzilla-index-pattern.json
kidash -e https://user:pass@localhost:443/data --import bugzilla.json

Edit this doc