Bugzilla Timing
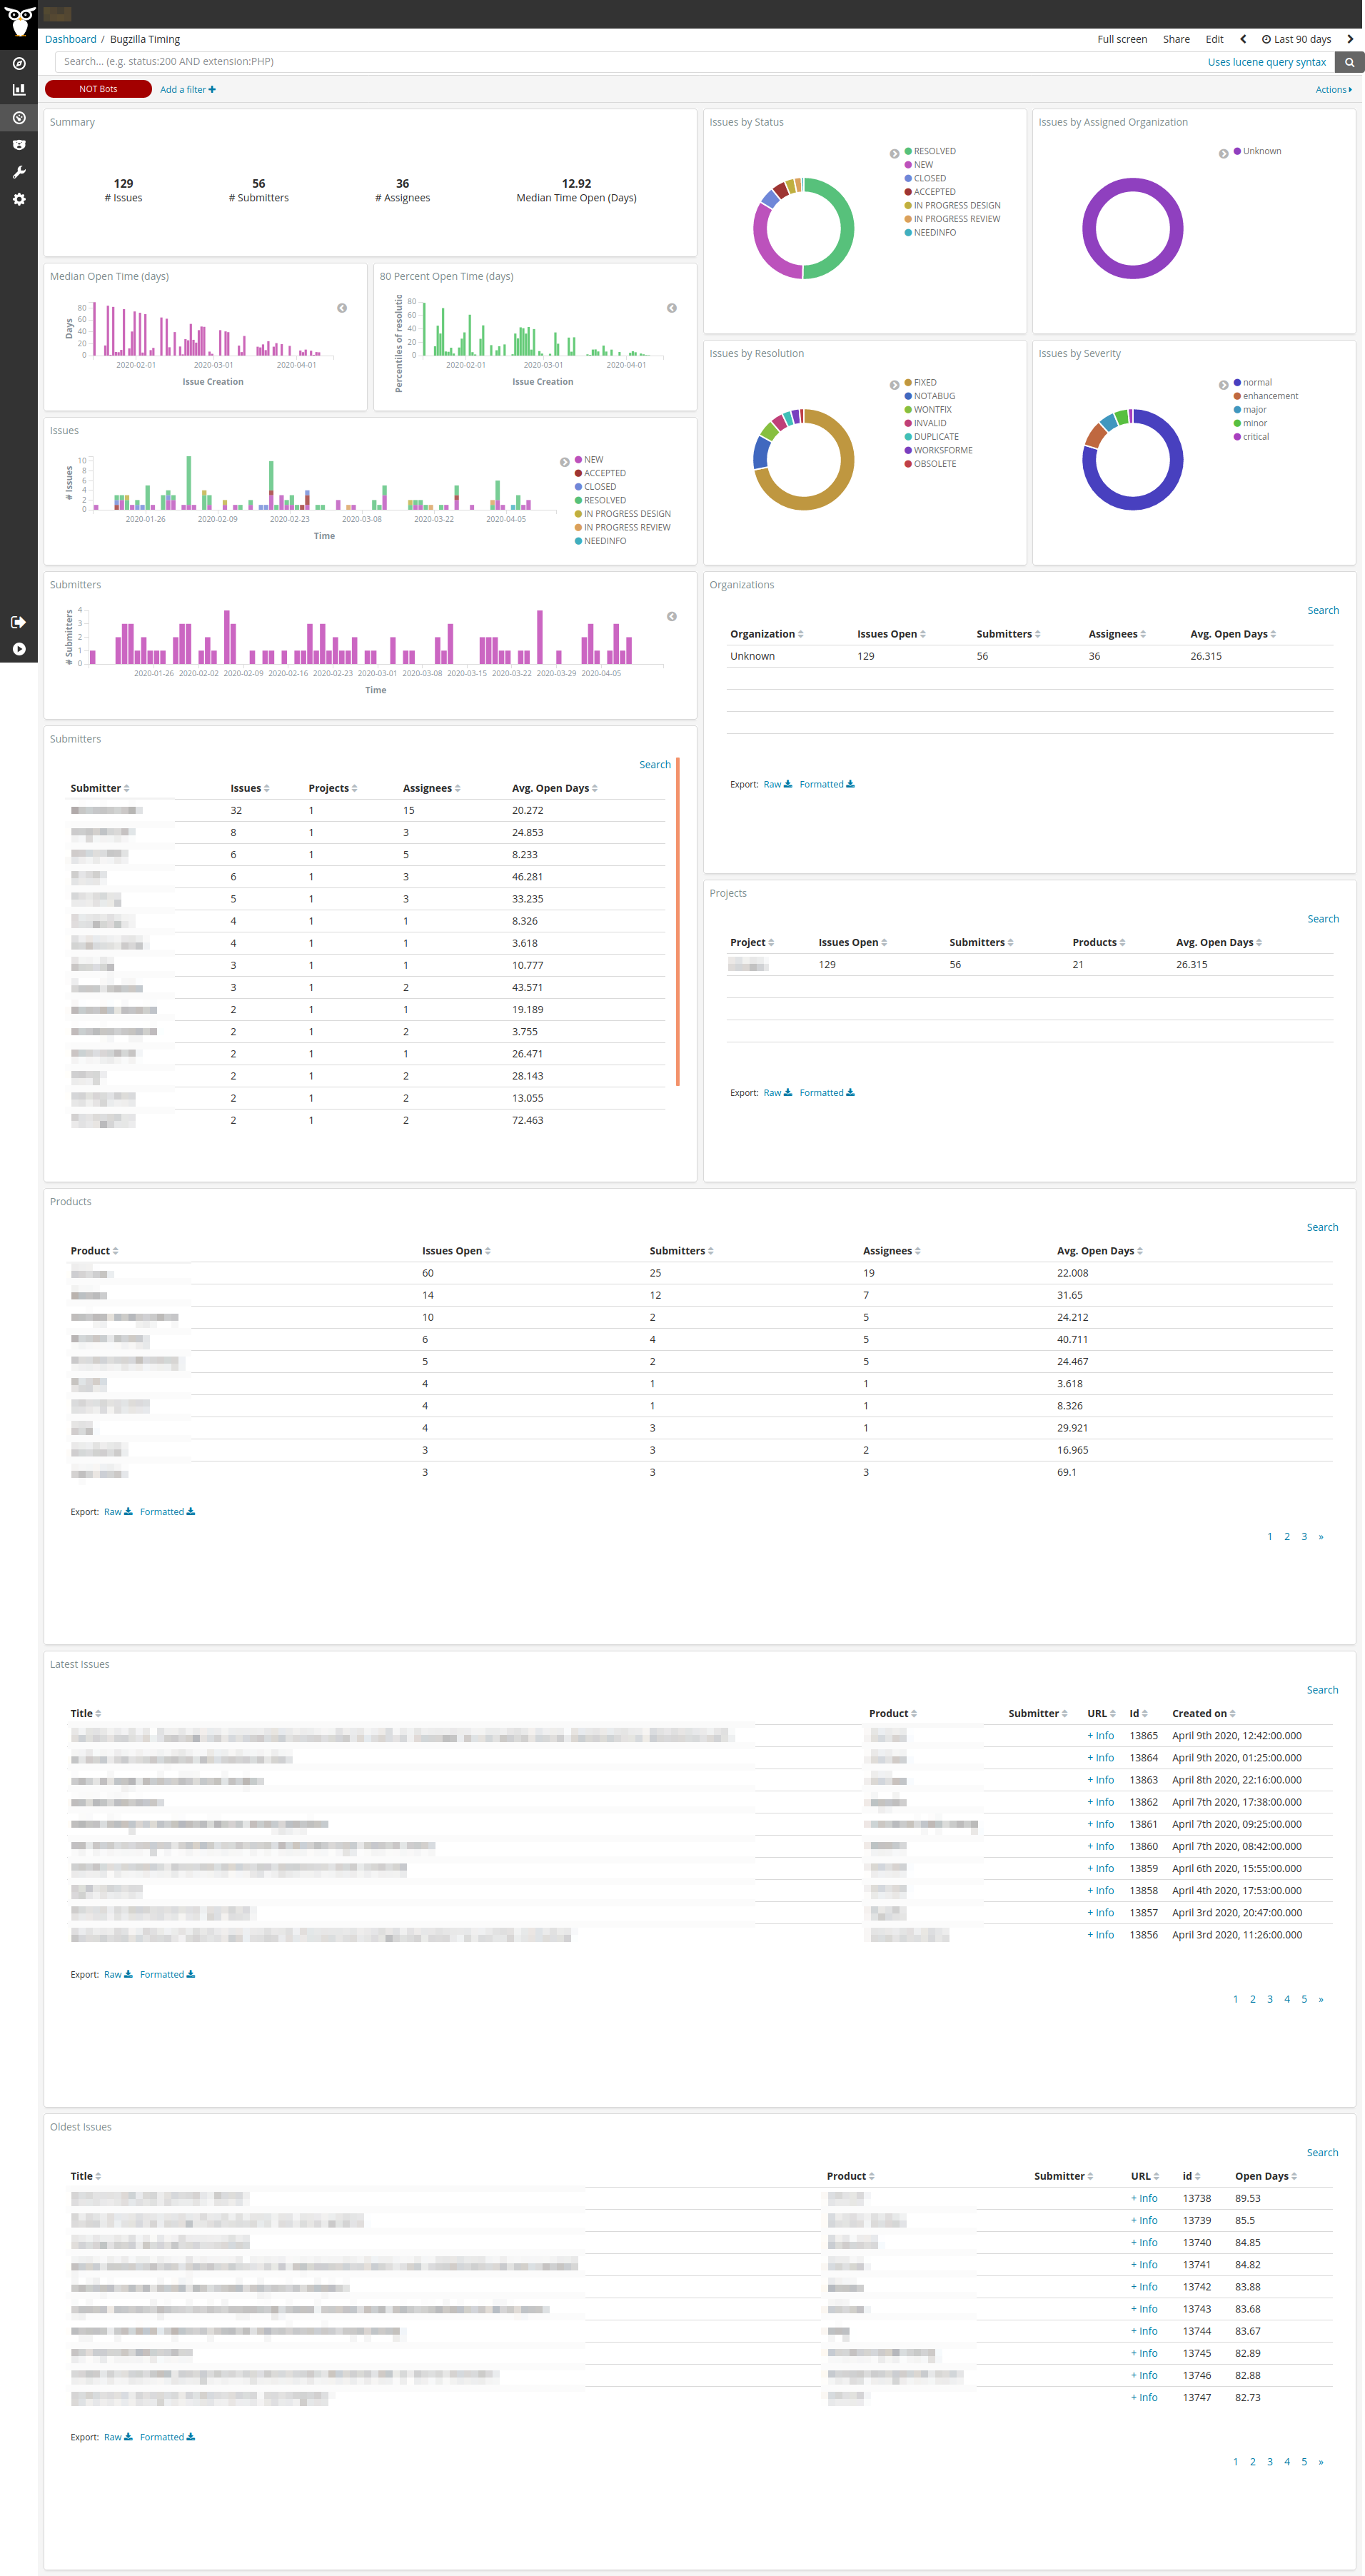
This dashboard contains information about the evolution of issues over time. It shows submitters, products and status of the issues, and gives also insights about the time to process them.
Among other information we can find statistical information on closing times and also tables with the latest and the oldest Issues.
Metrics
The metrics provided are:
- Summary: total numbers of issues, submitters, assignees and the median of the time the issues stay open (days).
- Issues by Status: a pie chart that summarizes the proportion of the issues by status.
- Issues by Assignee Organization: a pie chart that summarizes the issues by the assignees’ organization.
- Median Open Time (Days): a bar chart that shows the evolution of the median of the time the issues stay open (days).
- 80 Percent Open Time (Days): a bar chart that shows the evolution of the 80 percentile of the time the issues stay open (days).
- Issue: a bar chart that shows the evolution of the status of the issues over time.
- Issues by Resolution: a pie chart that summarizes the proportion of the issues by resolution type.
- Issues by Severity: a pie chart that summarizes the proportion of the issues by severity.
- Submitters: a bar chart that shows the evolution of the number of submitters over time.
- Organizations: a table sorted by organizations that details the number of issues open, submitters, assignees, and the average time the issues have been open (days).
- Submitters: a table sorted by submitters that details the number of issues, projects, assignees, and the average time the issues have been open (days).
- Projects: a table sorted by projects that details the number of issues open, submitters, products, and the average time the issue has been open (days).
- Products: a table sorted by products that details the number of issues open, submitters, assignees, and the average time the issue has been open (days).
- Latest Issues: a table separated by the title of the issues that details the product, submitter, bug URL, bug id, and date of the creation.
- Oldest Issues: a table separated by the title of the issues that details the product, submitter, bug URL, bug id, and date of the creation.
Files
To use this dashboard with your own GrimoireLab deployment you need to:
- Check
bugzillaindex is available on your GrimoireLab instance (see grimoirelab-sirmordred documentation for details on how to deploy it). - Import the following JSON files using Kidash tool.
| Index Pattern | —– | Dashboard |
Command line instructions
Once you have the data in place, if you need to manually upload the dashboard execute the following commands:
kidash -e https://user:pass@localhost:443/data --import bugzilla-index-pattern.json
kidash -e https://user:pass@localhost:443/data --import bugzilla_timing.json
Edit this doc