Community Structure by Project
In order to analyze community structure we rely on Onion model. All panels related to community structure are based on the onion study included in grimoirelab-elk project.
Metrics
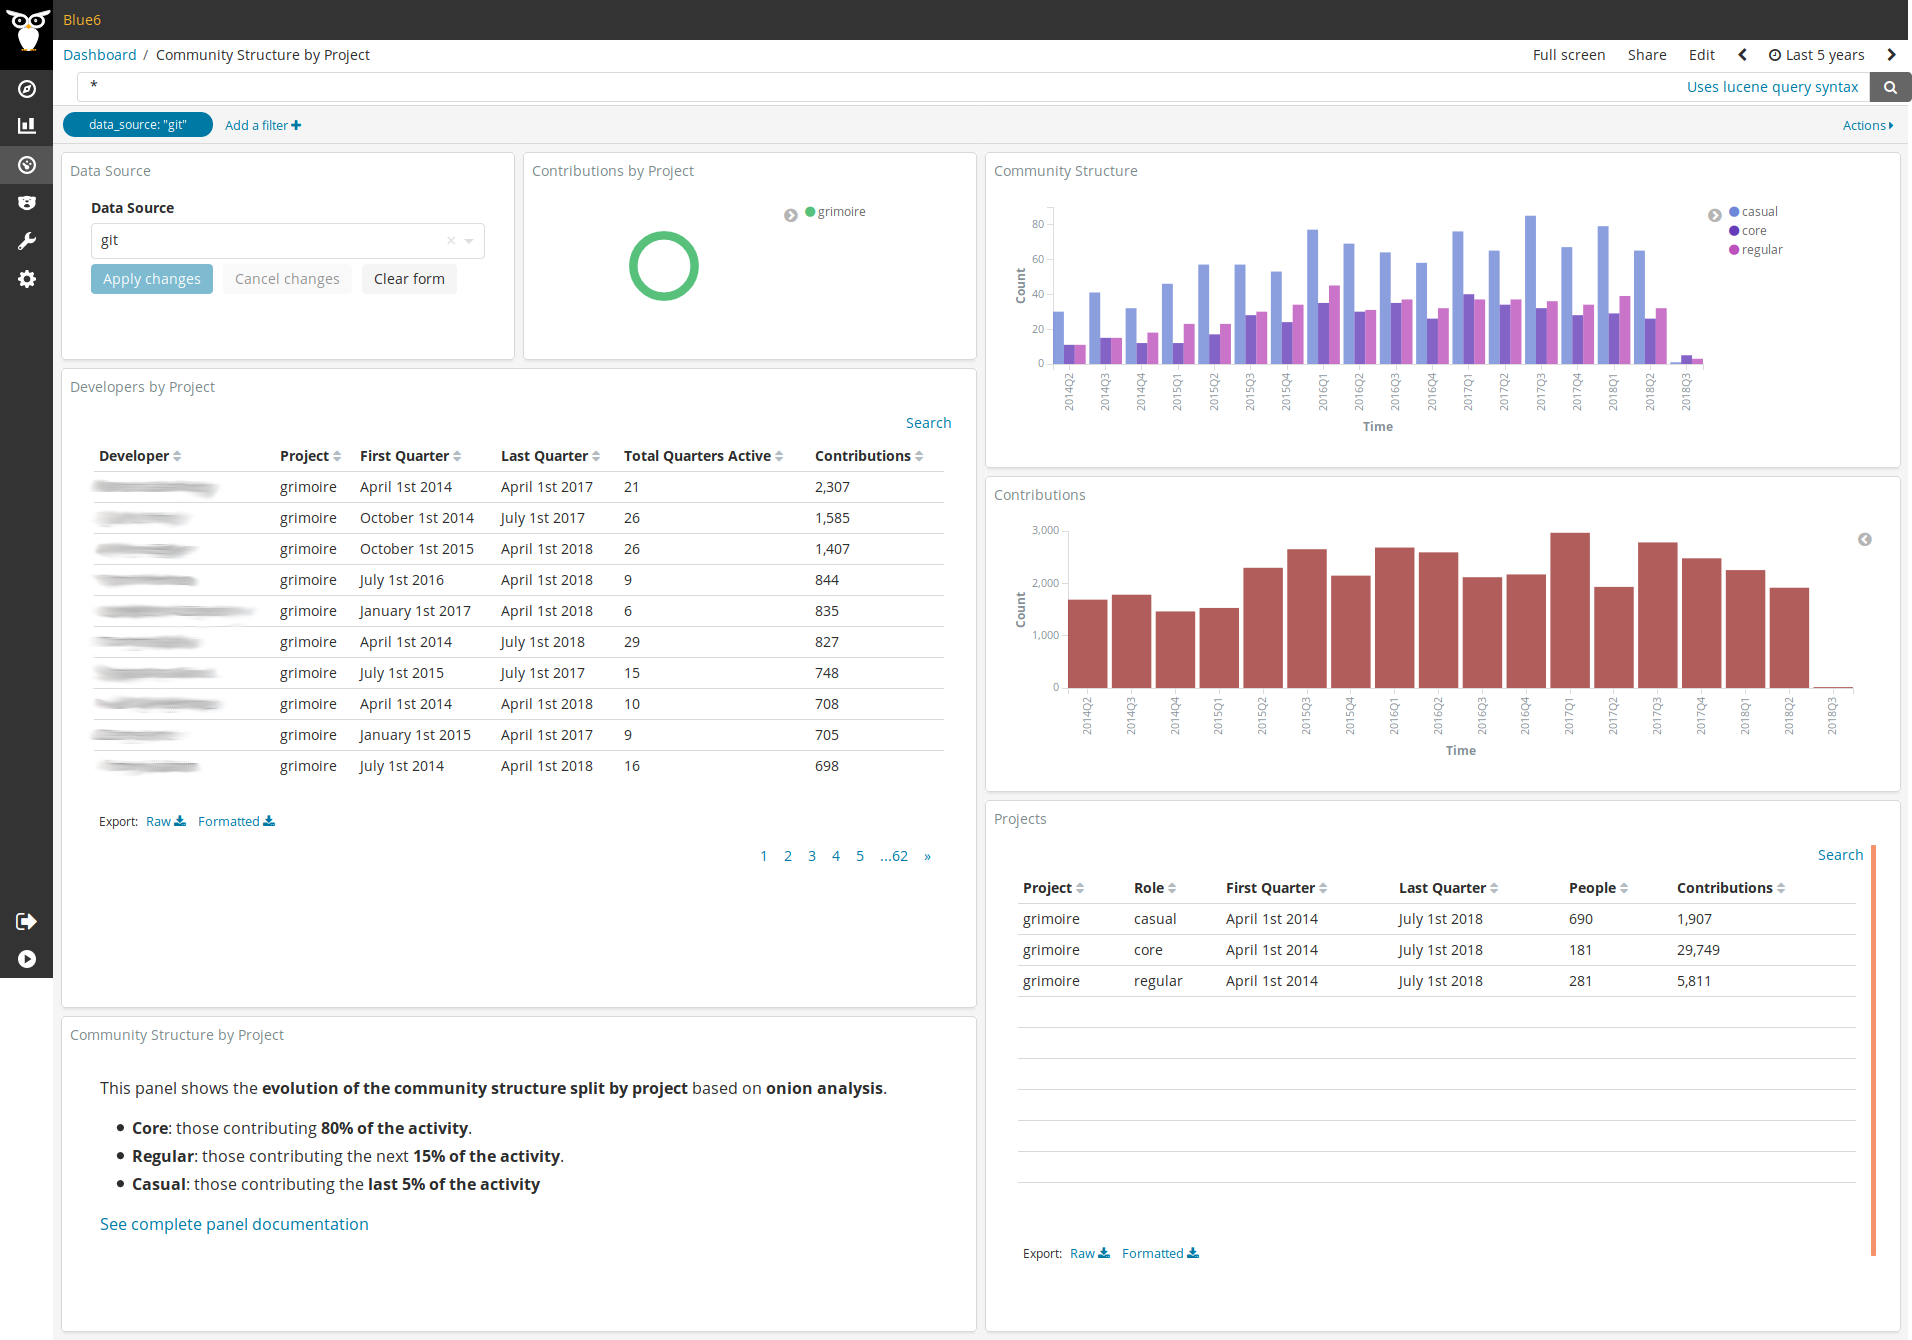
This panel splits data into projects. Onion model is computed individually for each project.
- Contributions by Project: this donut chart placed on the top of the panel splits number of contributions by project.
- Community Structure: on the top right corner we find the evolution of the different onion roles through time, divided by quarters.
- Contributions: just below, another bar chart shows the evolution of contributions in order to compare both to better understand how groups evolve.
- Authors: on the left hand side, a table of authors shows the total number of contributions of each one in the selected time frame together with the number of quarters that author has been active in the community.
- Projects: below bar charts, there is another table showing number of people and contributions by project and role for the selected time frame.
In addition to Kibana filters and search box on top, filtering by Data
Source is allowed by using the top left corner widget. Notice the blue filter
on top used for showing only Git data. This filter can be modified by using
Data Source widget mentioned above.
Use Notes
1. Only one data source filter should be active at the same time
In Kibana/Kibiter, filters are combined by means of AND operators.
E.g. if we enable Git and GitHub filters, under the hood we get
an ElasticSearch query like:
data_source=git AND data_source=github
Thus, by selecting more than one data source filter at the same time, we won’t get any result, because data come from one data source or another, but not several at the same time.
Data Source widget automatically manages this for you, so you just need
to select the desired data source in the drop down list and click on
Apply changes. Data is meaningful only if one and only one data source
is selected for filtering.
2. Select one and only one project to view meaningful data
In order to have meaningful data, we need to select the project we are interested in from the donut chart on top or from projects table below bar charts. Then, a new filter will appear on top, next to the other ones, and we’ll get the data we need in the panel.
LIMITATION: when no project is selected for filtering bar chart on the top left corner show group sizes —core, regular, casual— aggregated for all projects. That is, if we have project A with 5 people in core group for 2018Q1 and project B with 2 people in core group for 2018Q1, bar chart will show 7 as value for core group, which is not the result of computing onion for both projects together but the sum of their specific results. This is due to the use of pre-computed values by projects. In order to get data for all projects together, see Overall Community Structure panel.
Files
To use this dashboard with your own GrimoireLab deployment you need to:
- Check
all_onionindex is available on your GrimoireLab instance (see how to configure grimoirelab-elk studies and grimoirelab-sirmordred documentation for details on how to deploy it). - Import the following JSON files using Kidash tool.
| Index Pattern | —– | Dashboard |
Command line instructions
Once you have the data in place, if you need to manually upload the dashboard execute the following commands:
kidash -e https://user:pass@localhost:443/data --import all_onion-index-pattern.json
kidash -e https://user:pass@localhost:443/data --import onion_projects.json
Edit this doc