Contributors Growth
This panel aims at providing a view of the contributors, their evolution and their growth over time. This information is provided for all of the data sources and gives a glimpse about the differences between the periods of analysis. The information can be filtered by data source, by organization and by project.
Metrics
From left to right and top to bottom, the metrics provided are:
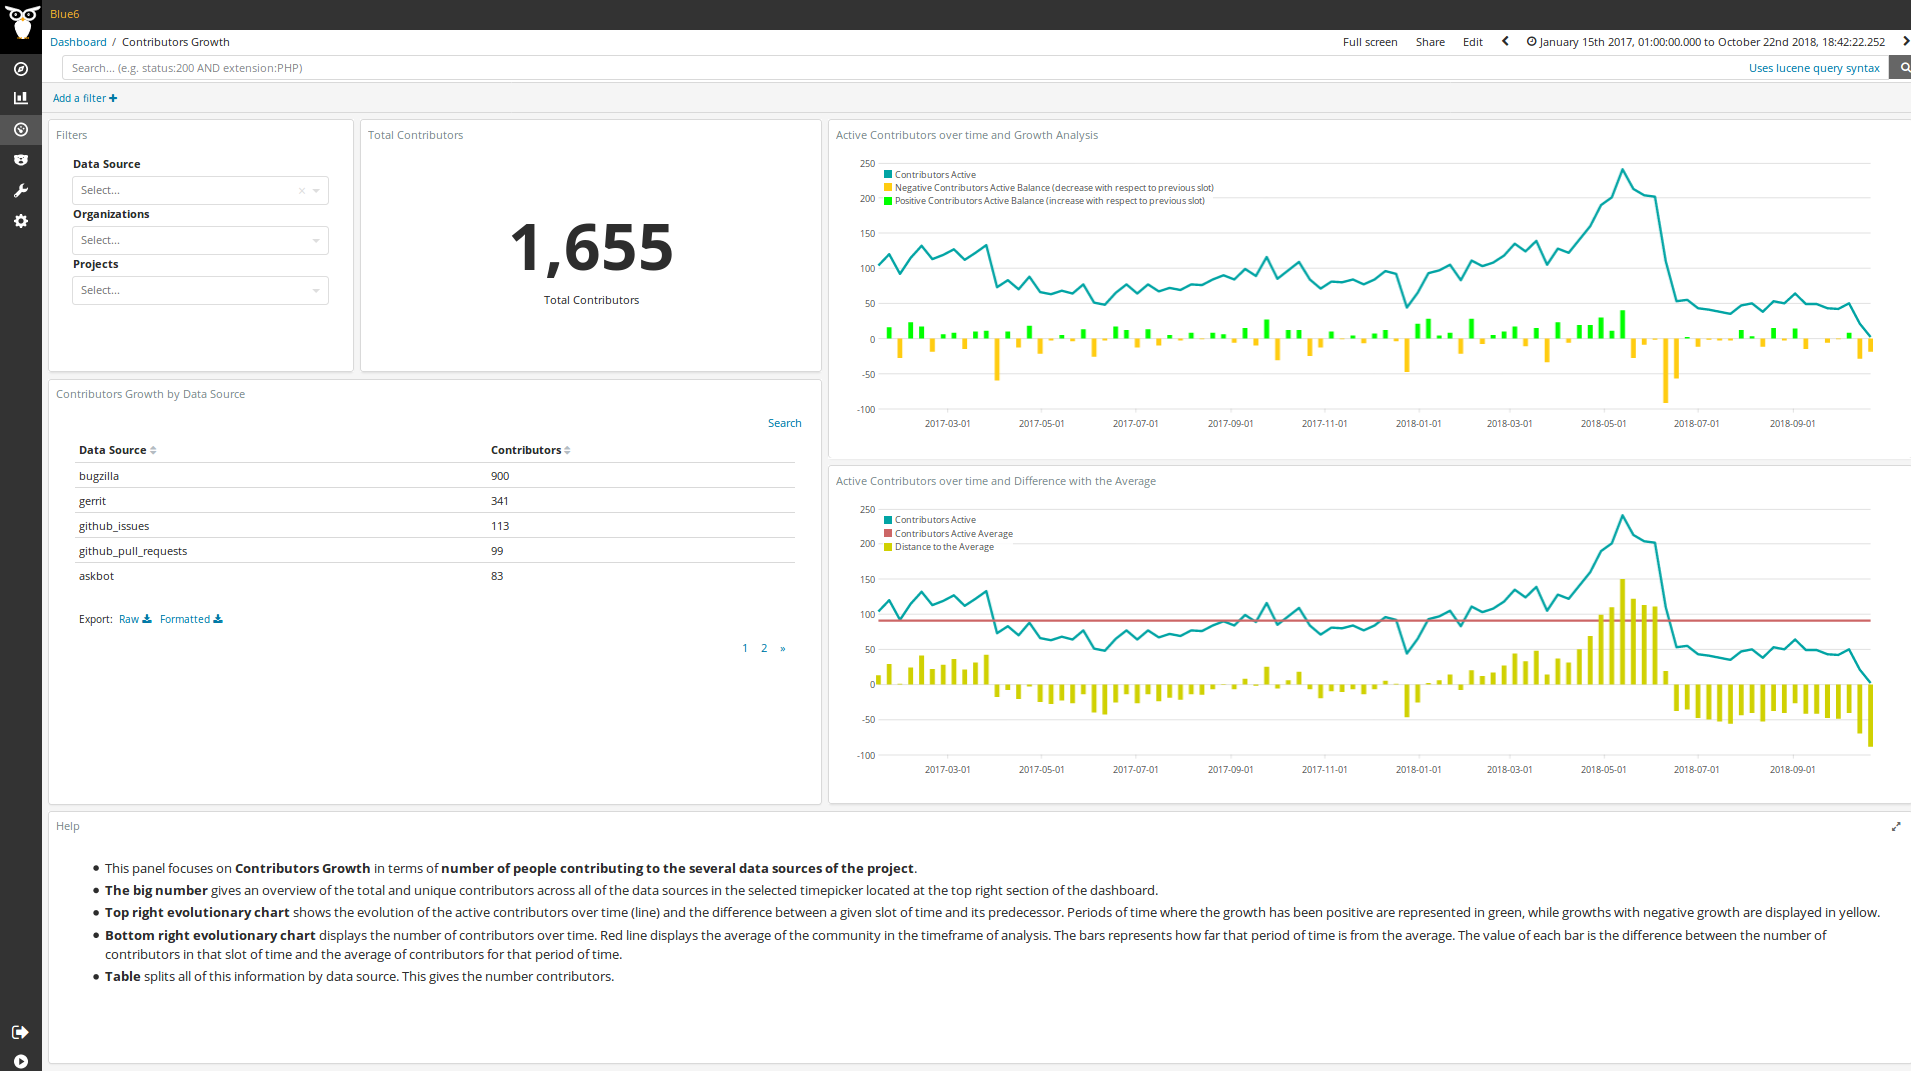
- Total Contributors: total number of unique contributors in any data source.
- Active Contributors over time and Growth Analysis: evolutionary chart displaying the number of active contributors in all of the data sources and the differences between each timeslot of analysis. The line represents the net number of contributors. The bar charts displays the difference between that timeslot and the previous one. If the difference is positive, so there’s a growth in the number of contributors, the bar is green, otherwise the bar is yellow.
- Contributors Growth by Data Source: this table displays the several data sources of analysis and the number of contributors in each of them.
- Active Contributors over time and Difference with the Average: evolutionary chart displaying the number of active contributors in all of the data sources and the difference between the average of contributors for the analyzed period and how far a timeslot is from that average. The green line represents the net number of contributors. The bar charts displays how far each of the slots of time in number of contributors are from the average. The average is represented as a horizontal line in red color. This displays the average number of contributors for the period of analysis.
In addition to Kibana filters and search box ont top, filtering by Data Source,
Organization and/or Project is allowed by using the top left corner widget.
Files
To use this dashboard with your own GrimoireLab deployment you need to:
- Check
all_enrichedindex is available on your GrimoireLab instance (grimoirelab-sirmordred automatically creates this alias for you). - Import the following JSON files using Kidash tool.
| Index Pattern | —– | Dashboard |
Command line instructions
Once you have the data in place, if you need to manually upload the dashboard execute the following commands:
kidash -e https://user:pass@localhost:443/data --import all_enriched-index-pattern.json
kidash -e https://user:pass@localhost:443/data --import contributors_growth.json
Edit this doc