Data Status
This panel shows information about data freshness. Looking at this panel we can check whether retrieval processes are working as expected. Basically, for each data source, you’ll find information about how many items we are currently storing in our system, dates of oldest and newest items, when we start indexing them in Elastic Search and when the most recent item was indexed.
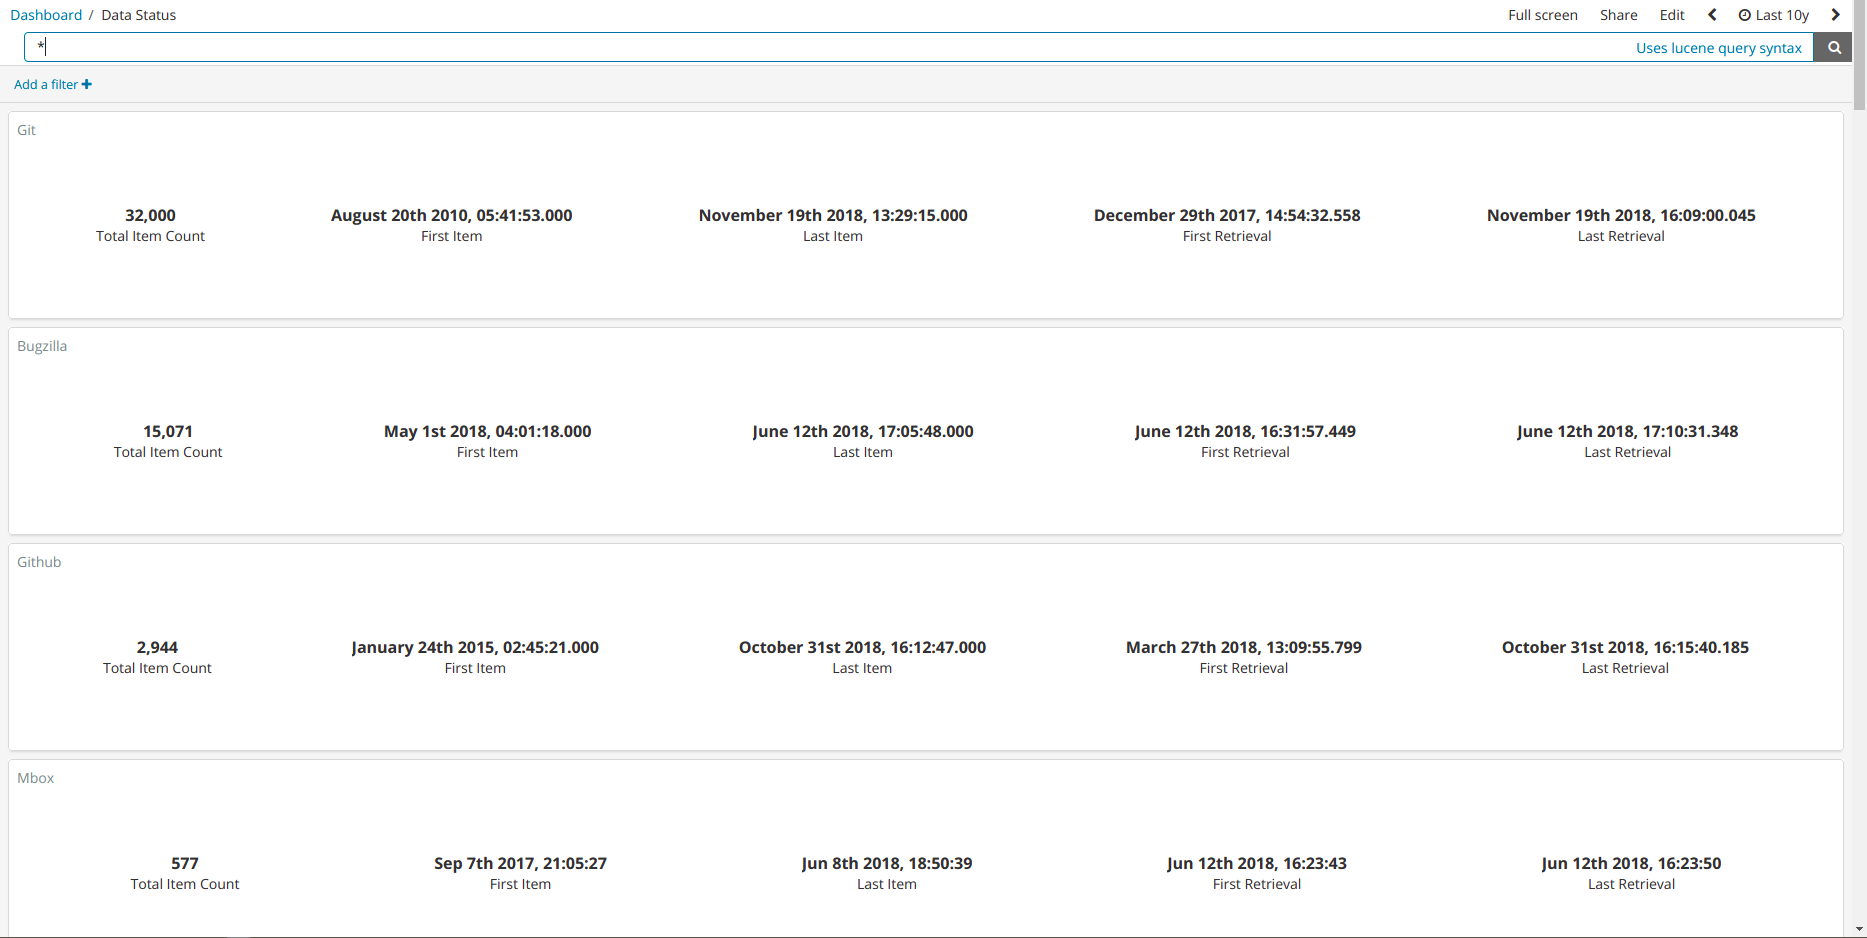
To show this information, in this panel we’ll find a widget (also called visualization in Kibana) for each and every data source showing the following entries:
- Data source name: it’s shown as widget title.
- Total item count: total number of items retrieved for the data source.
- First Item: oldest item creation date in data source, i.e. oldest creation date retrieved from the corresponding data source that we have stored.
- Last Item: newest item creation date in data source, i.e. most recent creation date retrieved from the corresponding data source that we have stored.
- First Retrieval: oldest item retrieval date, i.e., for the corresponding data source, date in which the first (oldest) item was stored in our system.
- Last Retrieval: newest item retrieval date, i.e., for the corresponding data source, date in which the last (most recent) item was stored in our system.
Index Fields Used
In case you need to work with this panel or any of its widgets, below you can find the correspondence between stored fields and widget texts:
- Total item count: it’s the count of all items stored in elastic search for the corresponding data source.
- First Item: it’s the minimum date value for
metadata__updated_on. - Last Item: it’s the maximum value for
metadata__updated_on. - First Retrieval: it’s the minimum value for
metadata__timestamp. - Last Retrieval: it’s the maximum value for
metadata__timestamp.
Field Description
Brief description of what used fields should contain:
metadata__updated_on: date of creation or last update of an item in its data source (git, gerrit, etc.)metadata__timestamp: date in which a given item was indexed in Elastic Search.
Example:
An item that was created in git on 2014-10-21 and it is recovered and indexed today in our system will have 2014-10-21 stored in metadata__updated_on and today’s date in metadata__timestamp. Here we show simplified dates, as you can see in Data Status Panel we are storing dates with milliseconds precision.
Files
This is a special dashboard that contains visualizations for all the different data sources available in GrimoireLab. Grimoirelab-sirmordred uploads it by default and removes all the visualizations corresponding to the data sources that aren’t active.
In case you want to upload it manually, you’ll need to remove those visualizations afterwards.
Just Import the following JSON file using Kidash tool and make sure the index patterns for the data sources you are interested in are in place on Kibana.
| Dashboard |
Command line instructions
Once you have the data in place, if you need to manually upload the dashboard execute the following commands:
kidash -e https://user:pass@localhost:443/data --import data_status.json
Edit this doc