Efficiency: Timing overview
This panel focuses on time to first attention and time to close tickets. The main goal here is finding out whether we are attending tickets early and solving them in a reasonable time.
Metrics
-
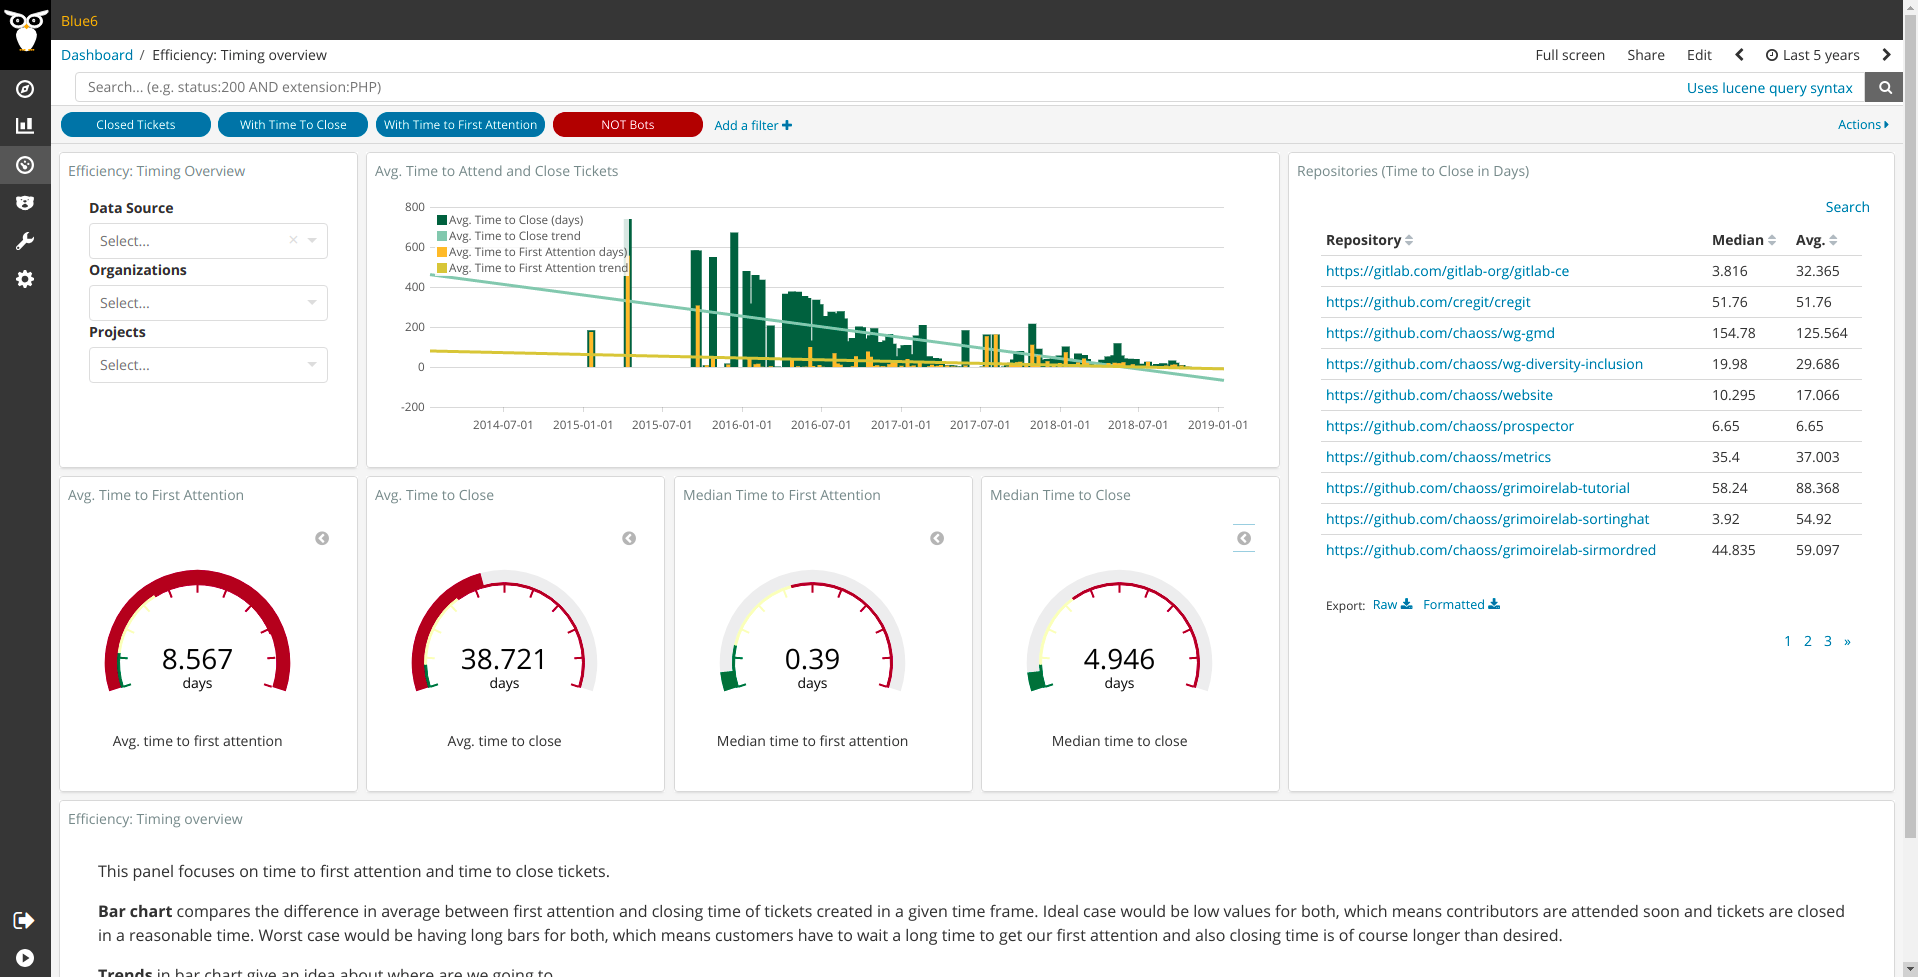
Average Time to Attend and Close Tickets bar chart compares the difference in average between first attention and closing time of tickets created in a given time frame. Ideal case would be low values for both, which means contributors are attended soon and tickets are closed in a reasonable time. Worst case would be having long bars for both, which means customers have to wait a long time to get our first attention and also closing time is of course longer than desired. Trends in bar chart give an idea about where are we going to.
- Gauges show times in average and median to complement bar chart with a more general
view. Despite we aren’t able to provide magic numbers that works for all projects, gauges
provide some tentative numbers that can be used as a reference:
- Time to First Attention: 1 day seems a reasonable time for a quick reply. Between 1 and 3 days is not that bad, while more than three days could be seen as too long for a first reply.
- Time to Close: in this case one week would be a very good term for solving a ticket, up to a month could still be reasonable for complex issues, but more than that is usually too long for most issues.
- Repositories on the right hand side provides a quick glance on how general numbers apply to particular repositories. It also allows to filter by repository in case we may want to specifically analyze its timing.
In addition to Kibana filters and search box ont top, filtering by Data Source, Organization
and/or Project is allowed by using the top left corner widget. Notice top filters in blue color
are used for filtering in closed tickets and red one is used for filtering out bots.
Files
To use this dashboard with your own GrimoireLab deployment you need to:
- Check
all_enriched_ticketsindex is available on your GrimoireLab instance (grimoirelab-sirmordred automatically creates this alias for you). - Import the following JSON files using Kidash tool.
| Index Pattern | —– | Dashboard |
Command line instructions
Once you have the data in place, if you need to manually upload the dashboard execute the following commands:
kidash -e https://user:pass@localhost:443/data --import all_enriched_tickets-index-pattern.json
kidash -e https://user:pass@localhost:443/data --import timing_overview_tickets.json
Edit this doc