Gerrit Approvals
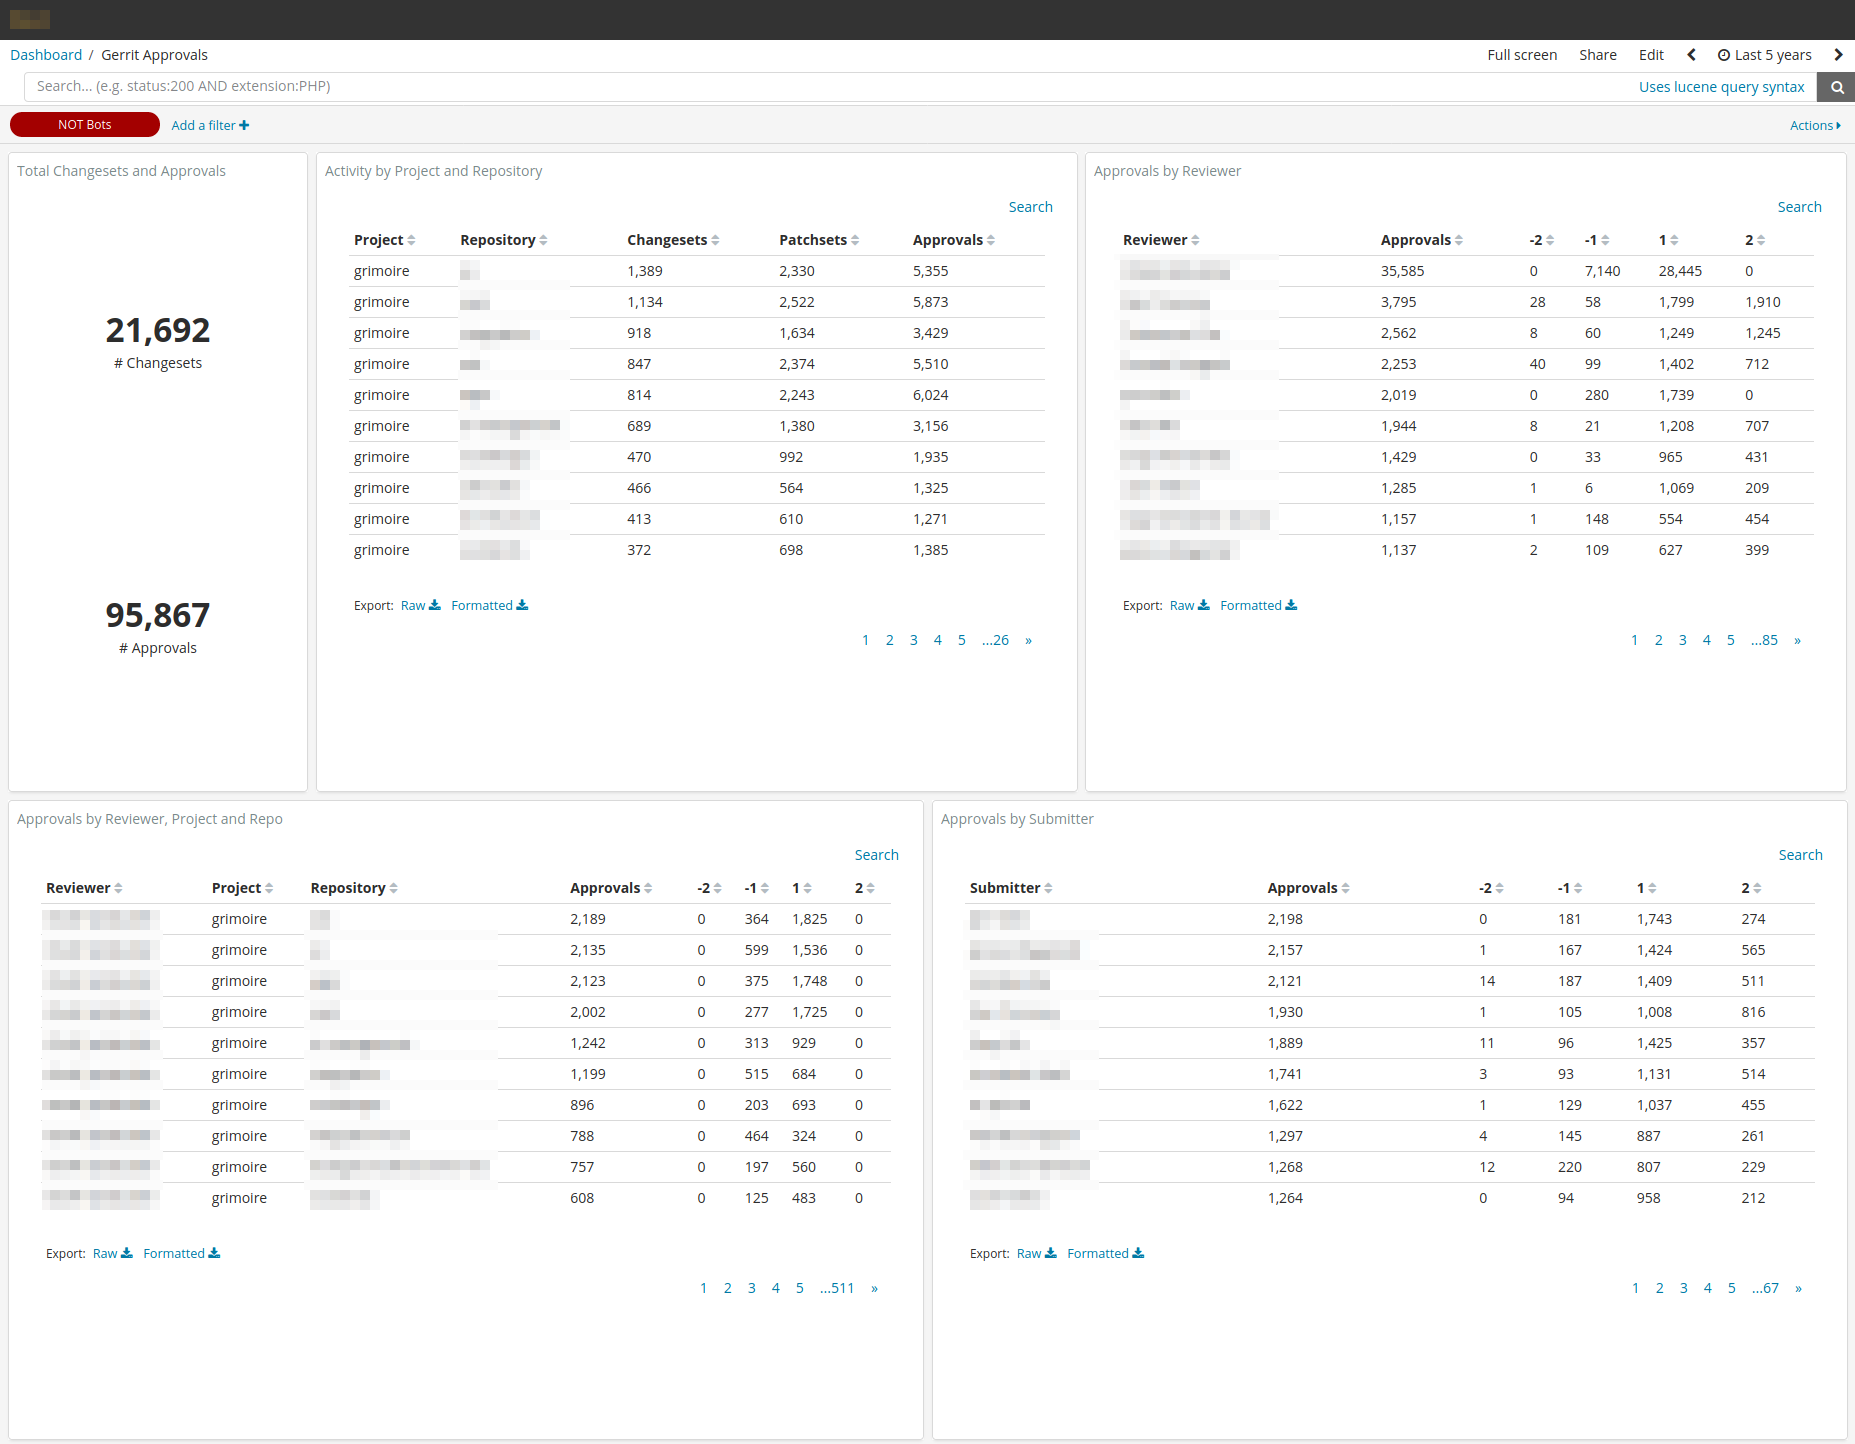
This dashboard focuses on metrics derived from Gerrit approvals. It provides insights in terms of projects, repositories, reviewers and submitters. Due to automation is a key part in Gerrit workflow a filter is set on the top of the dashboard (NOT Bots) to ignore any kind of activity issued by bots. This is the default behaviour. The visualizations composing the dashboard are described below.
- Total Changesets and Approvals: A set of metrics that show the total number of changesets and approvals.
- Activity by Project and Repository: A table that summarizes the number of changesets, patchsets and approvals per project and repository.
- Approvals by Reviewer: A table that describes the number of approvals grouped by their values (i.e., -2, -1, +1, +2) per reviewer.
- Approvals by Reviewer, Project and Repo: A table that describes the number of approvals and their values per review, project and repository.
- Approvals by Submitter: A table that summarizes the number of approvals and their values per changeset submitter.
Files
To use this dashboard with your own GrimoireLab deployment you need to:
- Check
gerritindex is available on your GrimoireLab instance (see grimoirelab-sirmordred documentation for details on how to deploy it). - Import the following JSON files using Kidash tool.
| Index Pattern | —– | Dashboard |
Command line instructions
Once you have the data in place, if you need to manually upload the dashboard execute the following commands:
kidash -e https://user:pass@localhost:443/data --import gerrit-index-pattern.json
kidash -e https://user:pass@localhost:443/data --import gerrit_approvals.json

Edit this doc