Gerrit Retention of Newcomers
This dashboard focuses on retention of Gerrit newcomers, thus it shows insights about the contributors and their activity.
We consider as newcomer every Gerrit user whose first patchset was made within a date range defined by a certain date and the current date.
The period of time for considering users as newcomers is defined with the time-picker (top-right corner). This means the dashboard will show the activity from people whose first patchset was made during the selected date range.
Important: The end date from the selected date range must be the current date (Now).
This panel shows information about activity, classifying contributors (newcomers) as Active or Leaving. We can say a newcomer is leaving when its last contribution was made before a defined time period, taking the current date as the end of this range.
By default, we are taking 90 days as threshold, which means:
- Any newcomer whose last contribution was more than 90 days ago will be considered as a leaving newcomer.
- Otherwise, it will be an active newcomer.
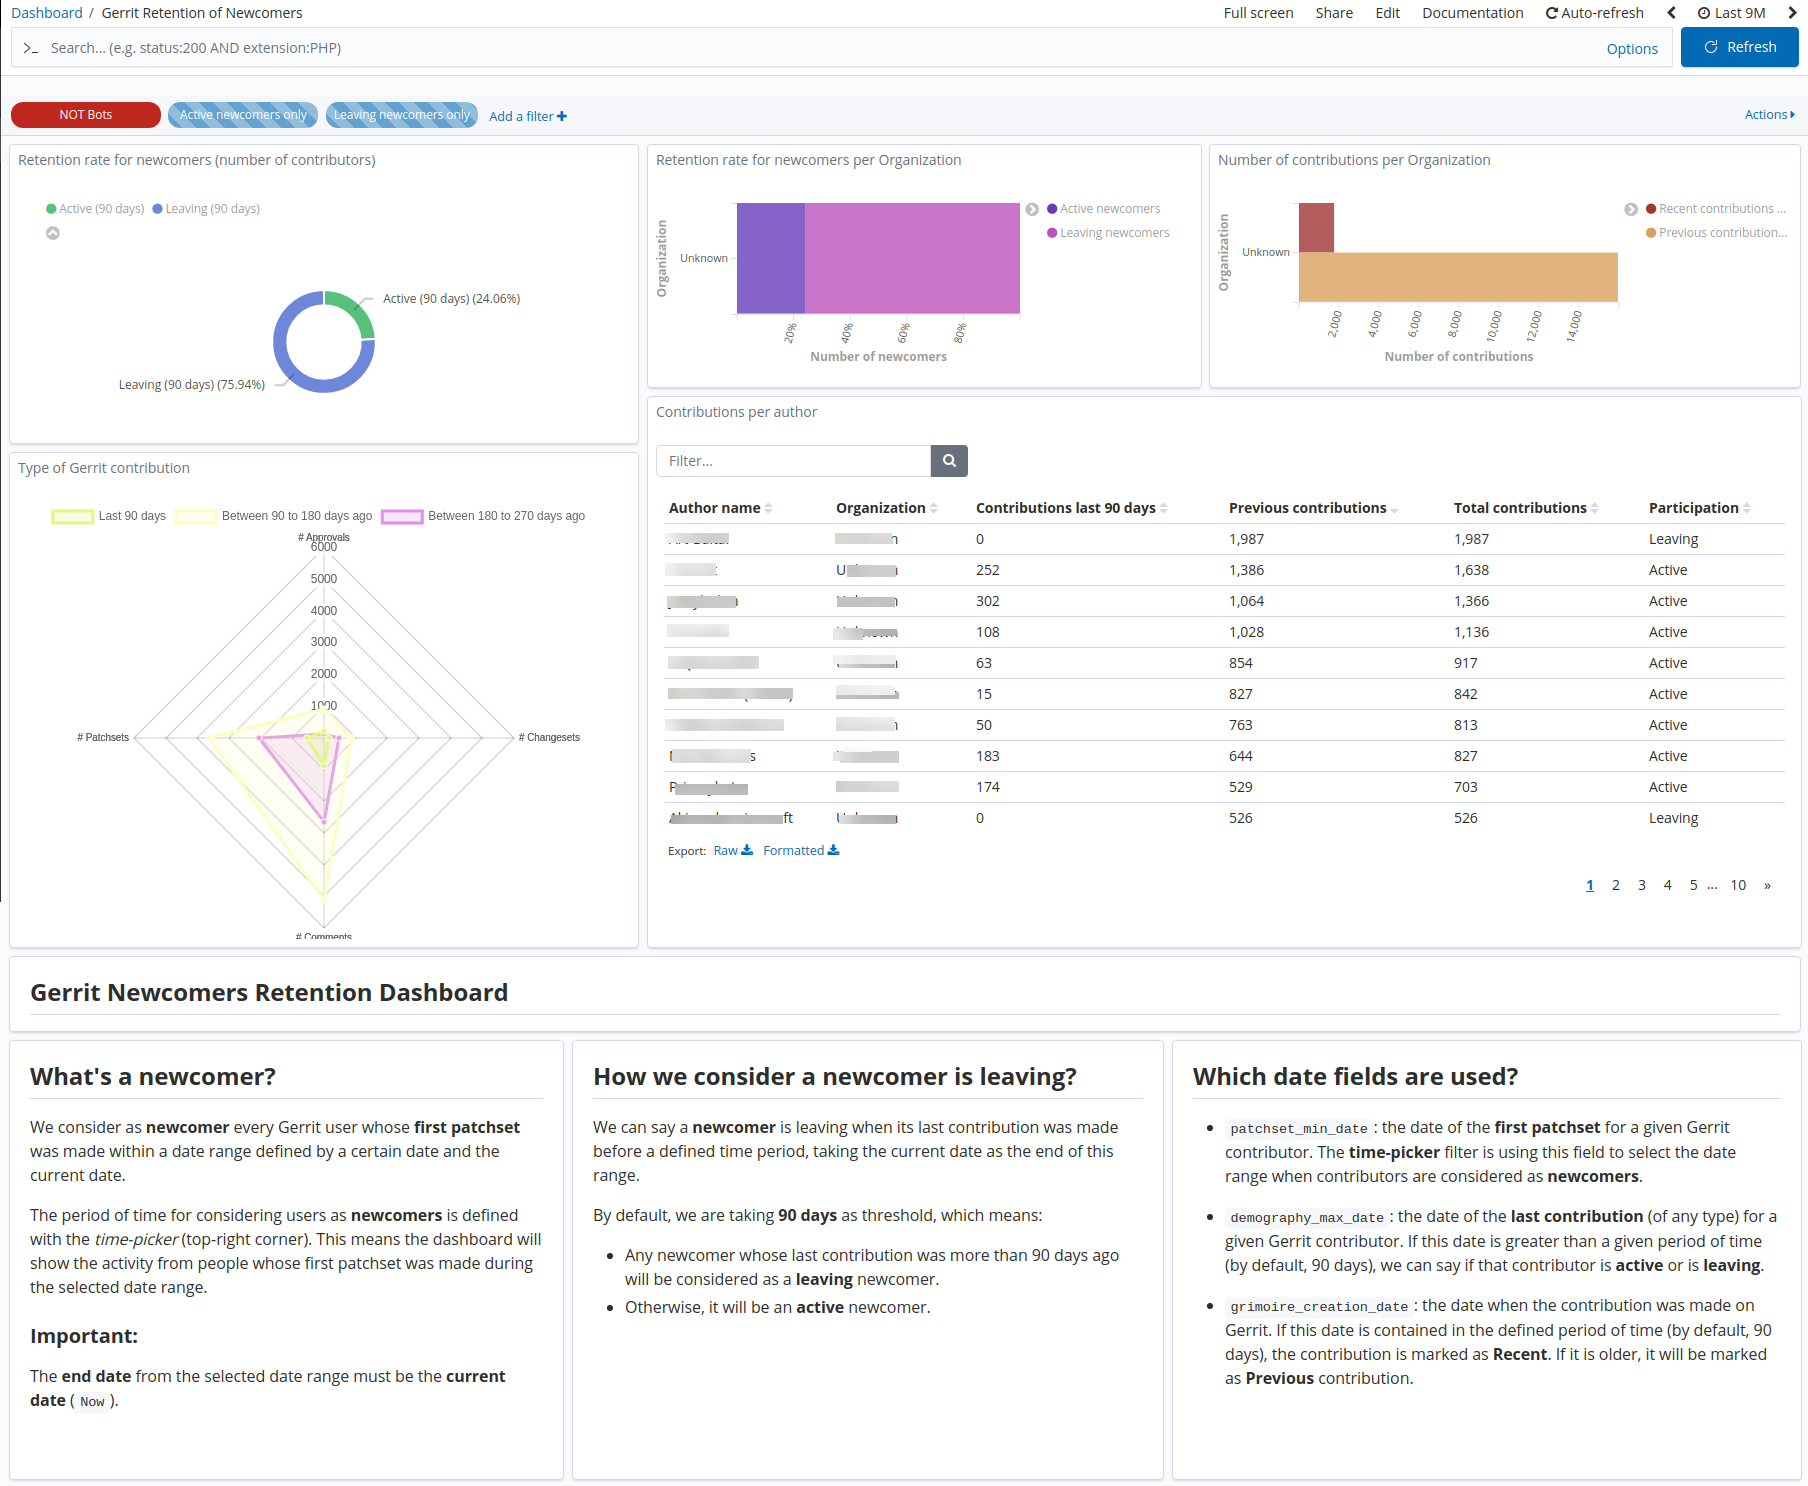
This is the list of visualizations (from left to right, top to bottom):
- Retention rate for newcomers (number of contributors): a pie chart representing the retention rate for newcomers; i.e. active vs. leaving contributors.
- Retention rate for newcomers per Organization: a stacked bar chart that shows the retention rate of newcomers according to their organization.
- Number of contributions per Organization: a bar chart showing the amount of recent and previous contributions per organization.
- Type of Gerrit contribution: a radar chart that depicts the amount of contributions per type (approvals, changesets, patchsets and comments) for different time periods of 90 days (Last 90 days, between 90 to 180 days ago and between 180 to 270 days ago).
- Contributions per author: a table showing the summary of the contributions for a given author (recent and previous ones), showing whether the contributor is active or not.
About date fields
These are the main date fields the visualizations use:
-
patchset_min_date: the date of the first patchset for a given Gerrit contributor. The time-picker filter is using this field to select the date range when contributors are considered as newcomers. -
demography_max_date: the date of the last contribution (of any type) for a given Gerrit contributor. If this date is greater than a given period of time (by default, 90 days), we can say if that contributor is active or is leaving. -
grimoire_creation_date: the date when the contribution was made on Gerrit. If this date is contained in the defined period of time (by default, 90 days), the contribution is marked as Recent. If it is older, it will be marked as Previous contribution.
Files
To use this dashboard with your own GrimoireLab deployment you need to:
- Check
demographics_contributionalias from Gerrit index is available on your GrimoireLab instance (see grimoirelab-sirmordred documentation for details on how to deploy it). Note that this index pattern usespatchset_min_dateas time field. - Import the following JSON files using Kidash tool.
| Index Pattern | —– | Dashboard |
Command line instructions
Once you have the data in place, if you need to manually upload the dashboard execute the following commands:
kidash -e https://user:pass@localhost:443/data --import demographics_contribution-index-pattern.json
kidash -e https://user:pass@localhost:443/data --import gerrit_retention_newcomers.json
Edit this doc