GitHub Issues Efficiency
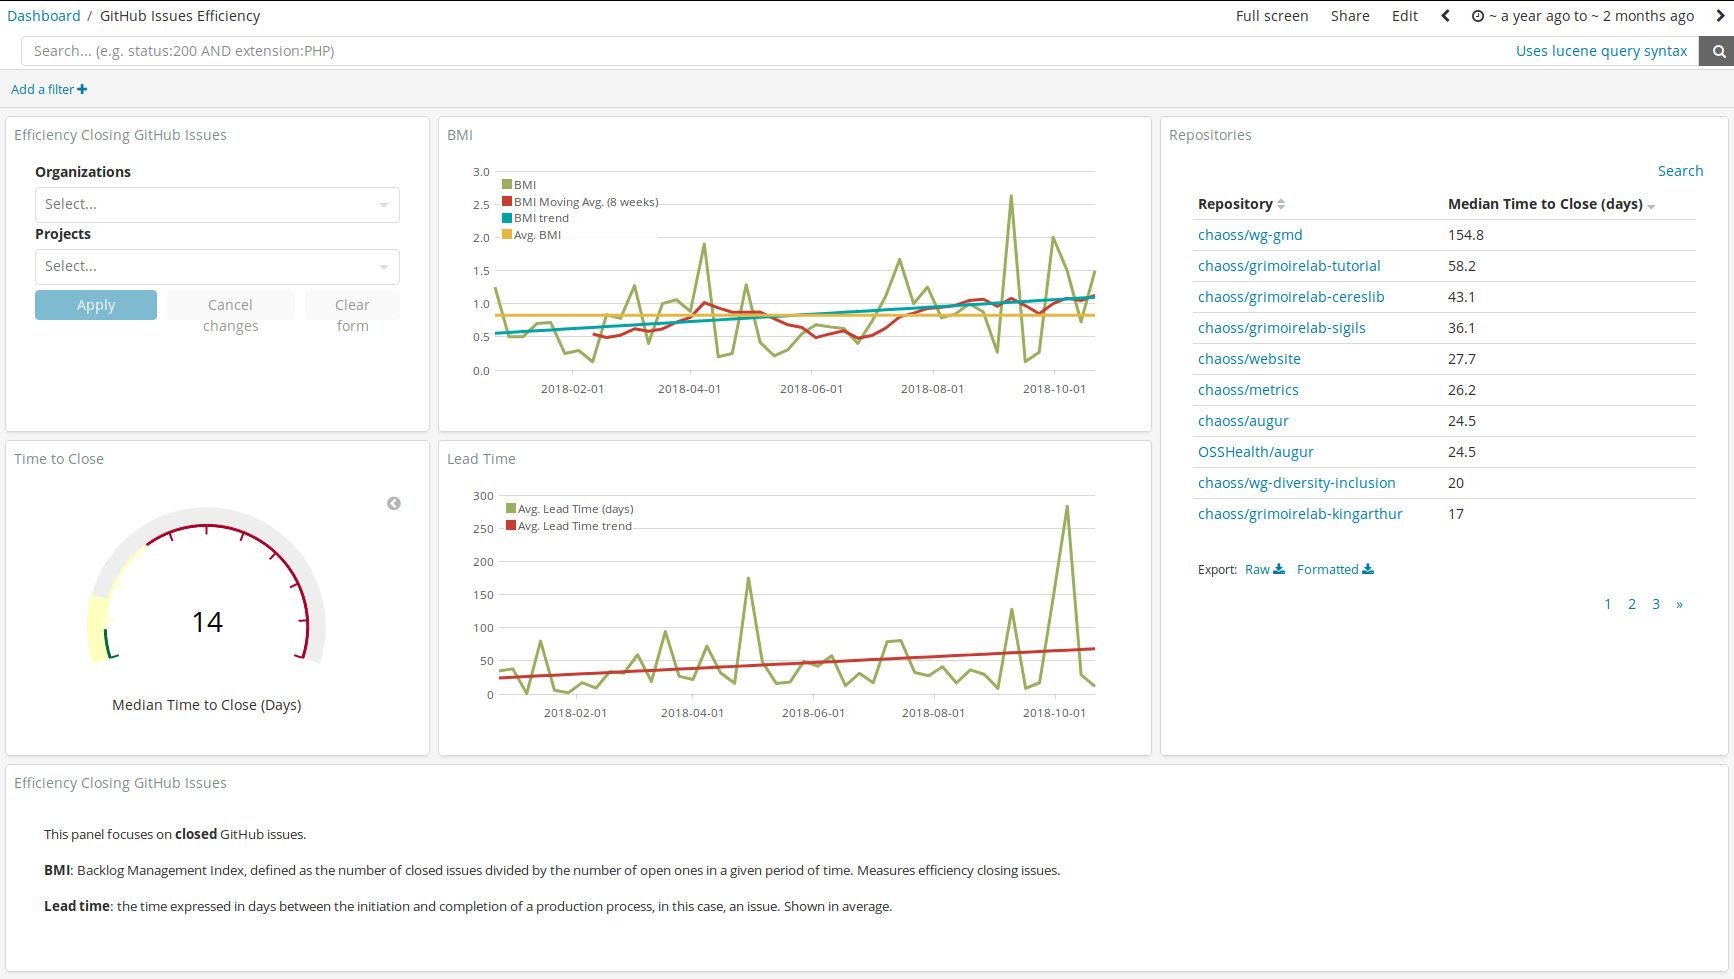
This panel offers a view of efficiency closing issues based on two metrics:
- BMI: Backlog Management Index, defined as the number of closed issues divided by the number of open ones in a given period of time. Measures efficiency closing issues.
- Lead Time: the time expressed in days between the initiation and completion of a production process, in this case, an issue. Shown in average in this panel.
- Time to Close: time from issue creation to the moment in which it’s closed.
Filtering by Organization and Project is allowed by using the top left corner widget.
BMI is shown next to filtering widget. Moving average is set to 8 weeks to identify changes in trends. Average is also shown as reference. BMI values greater than 1 means the community is closing more tickets than those they are opening. Values smaller than 1 means the opposite, i.e., more tickets open than those closed during a given time frame.
Median Time to Close gauge is set to show green color for less than 7 days, yellow for values from 7 to 30 days and red from 30 to 90 days. This means we are considering a week as a good time to close. This is just a visual reference and you can always rely on the number, ignoring this color scheme.
Next to this gauge, Lead Time shows the average Time to Close expressed in days together to its trend. This helps to identify peaks and visualize the global evolution of time spent in closing issues.
Finally, a table on the right splits Median Time to Close by repository, giving an insight on the differences among them.
Files
To use this dashboard with your own GrimoireLab deployment you need to:
- Check
github_issuesindex is available on your GrimoireLab instance (see grimoirelab-sirmordred documentation for details on how to deploy it). - Import the following JSON files using Kidash tool.
| Index Pattern | —– | Dashboard |
Command line instructions
Once you have the data in place, if you need to manually upload the dashboard execute the following commands:
kidash -e https://user:pass@localhost:443/data --import github_issues-index-pattern.json
kidash -e https://user:pass@localhost:443/data --import github_issues_efficiency.json
Edit this doc