GitHub Pull Requests Comments and Collaboration
This dashboard focuses on collaboration among people. Its goal is providing insights about the most active and participative individuals. It also provides information split by repository and project in order to be able to compare data from a single person to data from the whole repository and project.
Collaboration is analyzed through the number of pull requests commented by a set of users. Thus we consider they are “collaborating” on that thread as they are sharing comments or code reviews. As a simple way to measure these interactions we consider the more the messages written in that thread, the stronger the collaboration is.
IMPORTANT: from now on, we are considering as comments either regular comments or pull requests reviews.
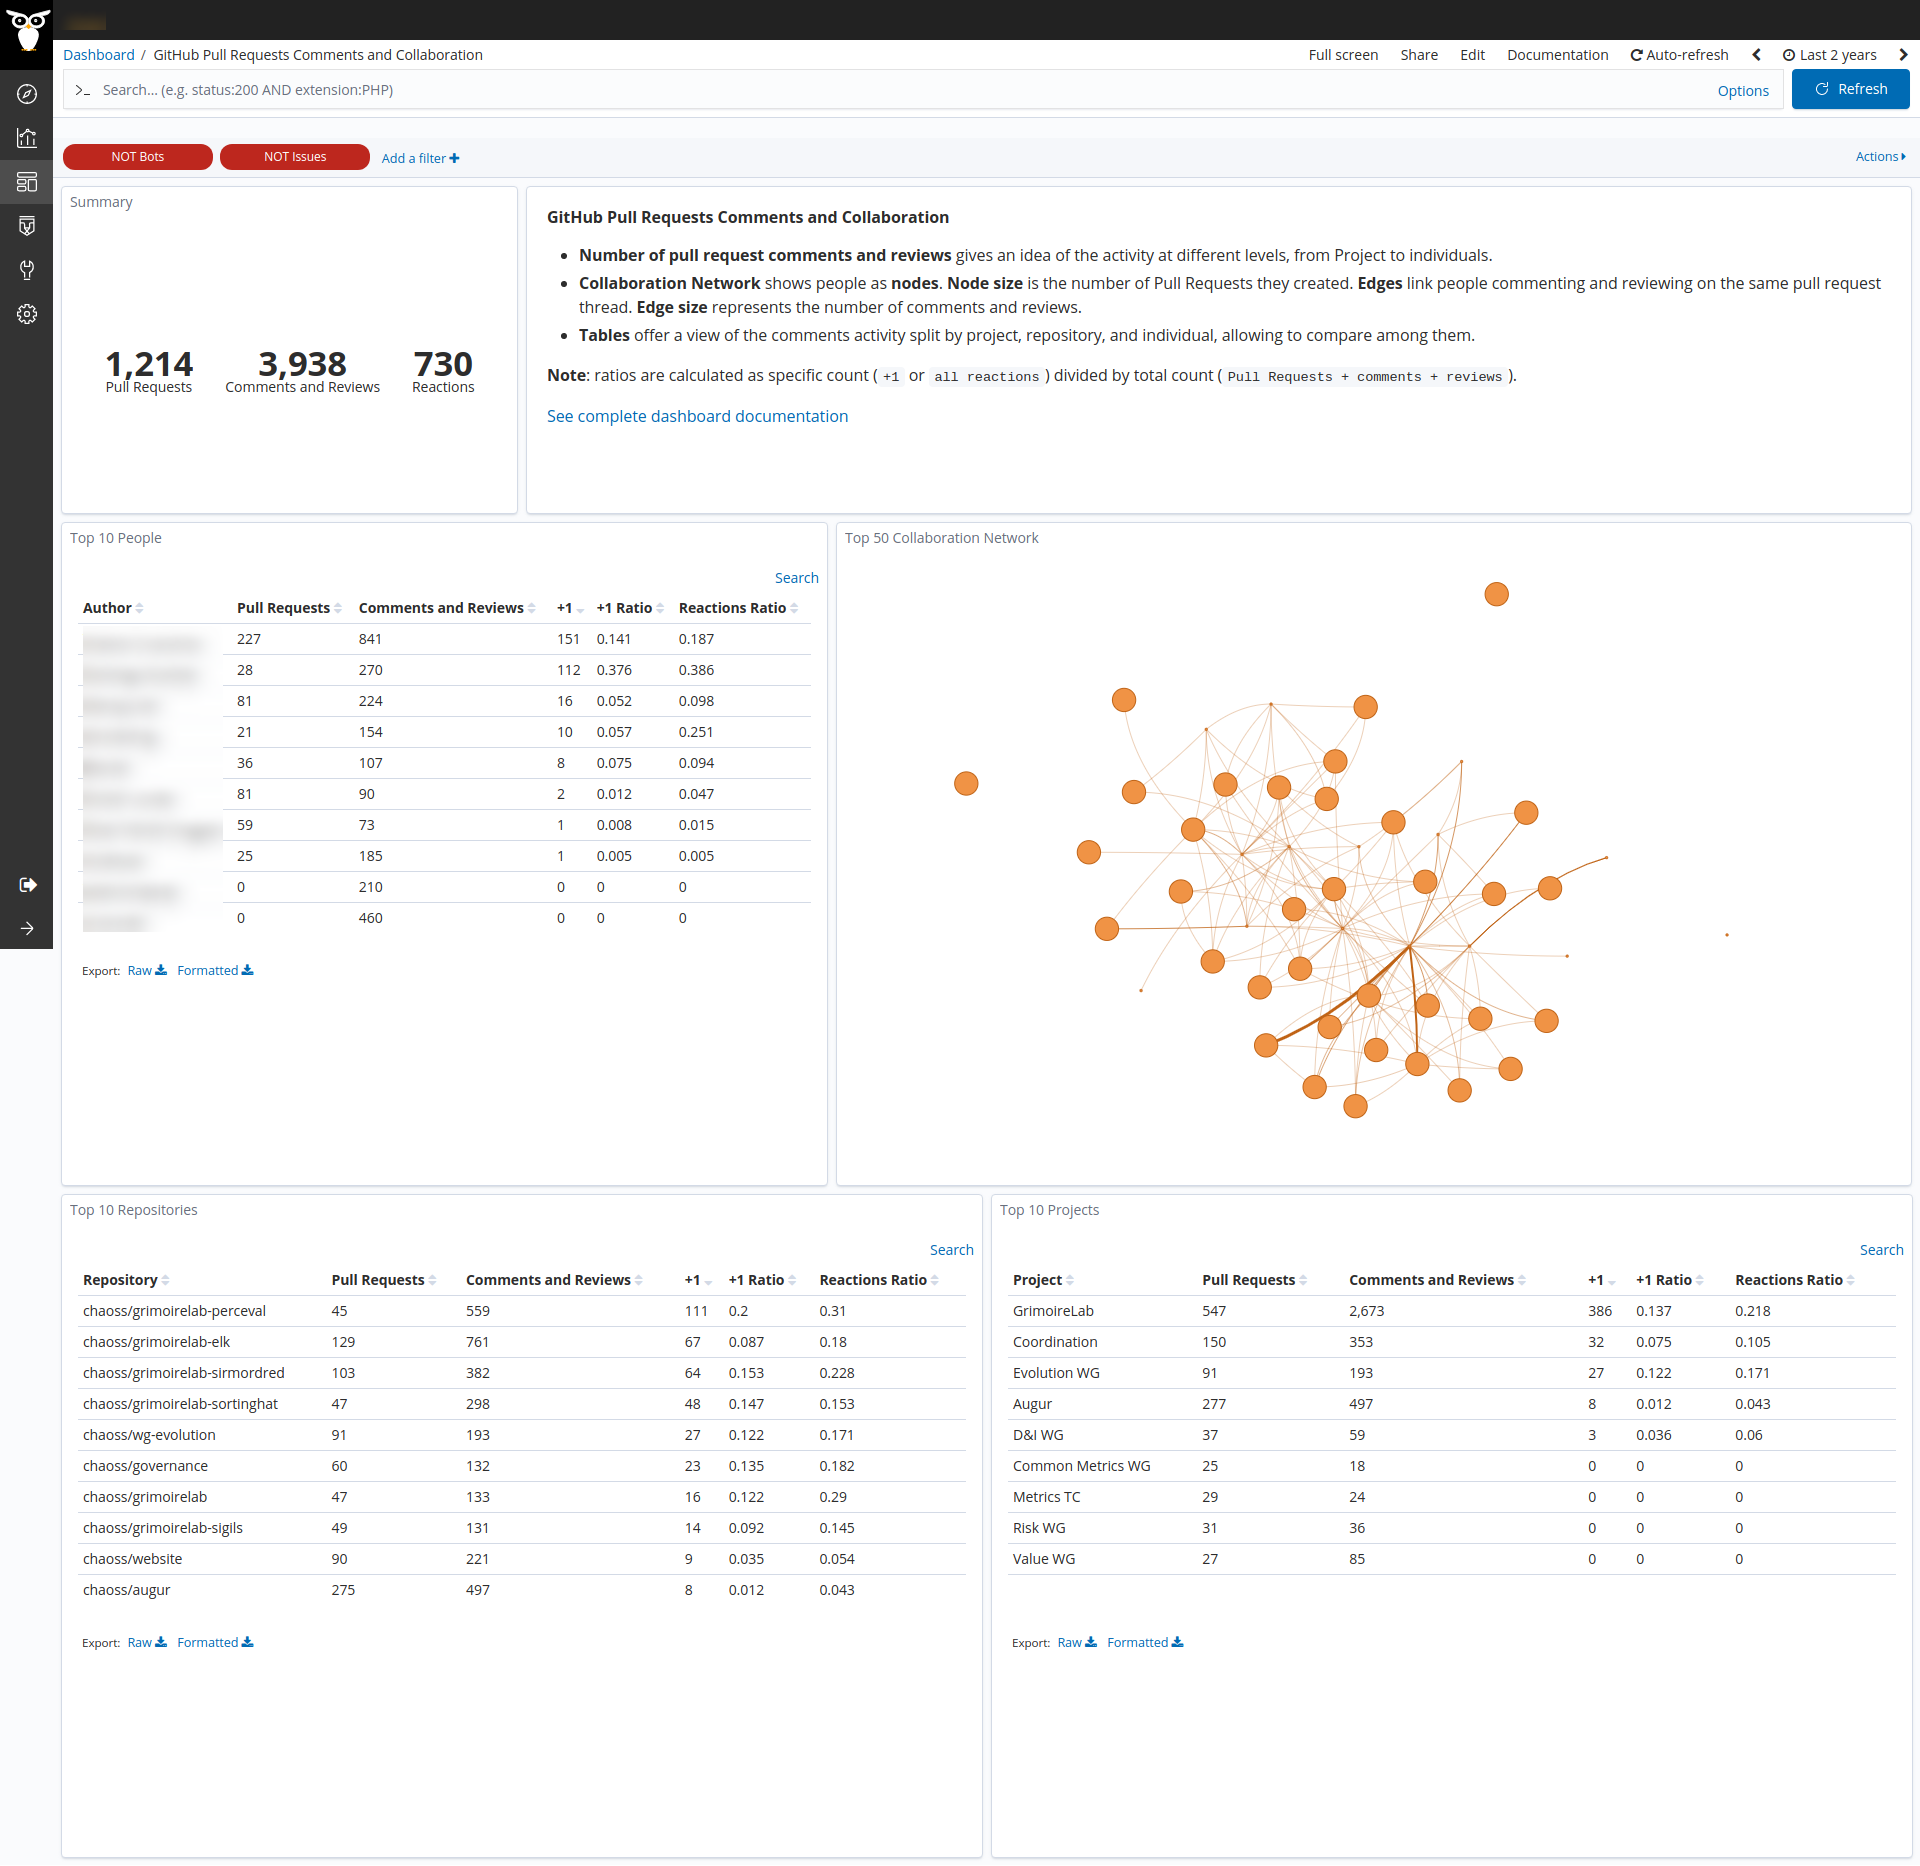
- Summary: general numbers to give an idea about the amount of data taken into account given the current dashboard filters and time frame.
- Top 50 Collaboration Network: shows people as nodes (first 50).
- Node size is the number of pull requests they created.
- Edges link people commenting on the same thread.
- Edge size represents the number of comments.
- Top 10 People: this table split data by persons (first 10). Each row consists of:
- Pull Requests: number of pull requests created by that person.
- Comments: number of comments created by that person.
- +1: number of
+1reactions received by pull requests or comments created by that person. - +1 Ratio: result of dividing the previous value by the total count of pull requests and comments created by that person.
- Reactions Ratio: same as
+1 Ratiobut for all kind of reactions. Useful to compare to+1 Ratioand thus analyze the impact of people’s contributions.
- Top 10 Repositories: same as People table but split by repository (first 10).
- Top 10 Projects: same as People table but split by project (first 10).
Tables are here to allow to drill down on people’s contributions and understand their actual impact on the different repositories and projects. Nevertheless, these tables provide enough information for comparing GitHub pull requests activity on the different repositories and projects, what could be considered as a side use case.
Building the Dashboard: details about Index and Fields
This dashboard is built on top of an alias (github2_pull_requests) that combines two separate physical indexes that store GitHub Issues in one case and GitHub Pull Requests in the other. To better understand why this is needed, let’s explain some details about how GitHub data looks like:
- Comments corresponding to pull requests in the issues index are regular comments in the pull requests threads, while those coming from the pull requests index are reviews. We need to get both of them to analyze all the activity around a given pull request.
- The github2_pull_requests index is actually a filtered alias to show data from issues corresponding to pull requests and data from the pull requests themselves.
- In the GitHub API everything are issues, even pull requests. That means any pull request will appear once in the issues index and another in the pull requests index.
- To avoid counting the pull requests twice, we filter out issues through a filter
named
Not Issuesplaced on top of the dashboard. This way we include the comments from the issues, but not the issues themselves, as their data are already included in the pull requests index.
The result is getting data for pull requests, their reviews and their regular comments (those that are not reviews).
The fields that can be used to aggregate data from both issues and pull requests are:
issue_url: the URL of the issue is shared by items coming from both issues and pull requests indexes.issue_title: the title is propagated to allow to group items related to given issues and pull requests by a more meaningful field. Of course if more than one issue had the same title, they will be aggregated together so using it as a second level aggregation or by means ofTop Hitsmetric could be a better approach to overcome this case.is_github_comment: used to be able to sum comments and reviews all together.issue_id_in_repo: this works only at repo level as they are unique by repo only. As pull requests are issues too, they also contain this id.
Files
To use this dashboard with your own GrimoireLab deployment you need to:
- Check
github2_pull_requestsindex is available on your GrimoireLab instance (see grimoirelab-sirmordred documentation for details on how to deploy it). - Import the following JSON files using Kidash tool.
| Index Pattern | —– | Dashboard |
Command line instructions
Once you have the data in place, if you need to manually upload the dashboard execute the following commands:
kidash -e https://user:pass@localhost:443/data --import github2_pull_requests-index-pattern.json
kidash -e https://user:pass@localhost:443/data --import github2_pull_requests_comments_and_collaboration.json
Edit this doc