GitHub Repositories
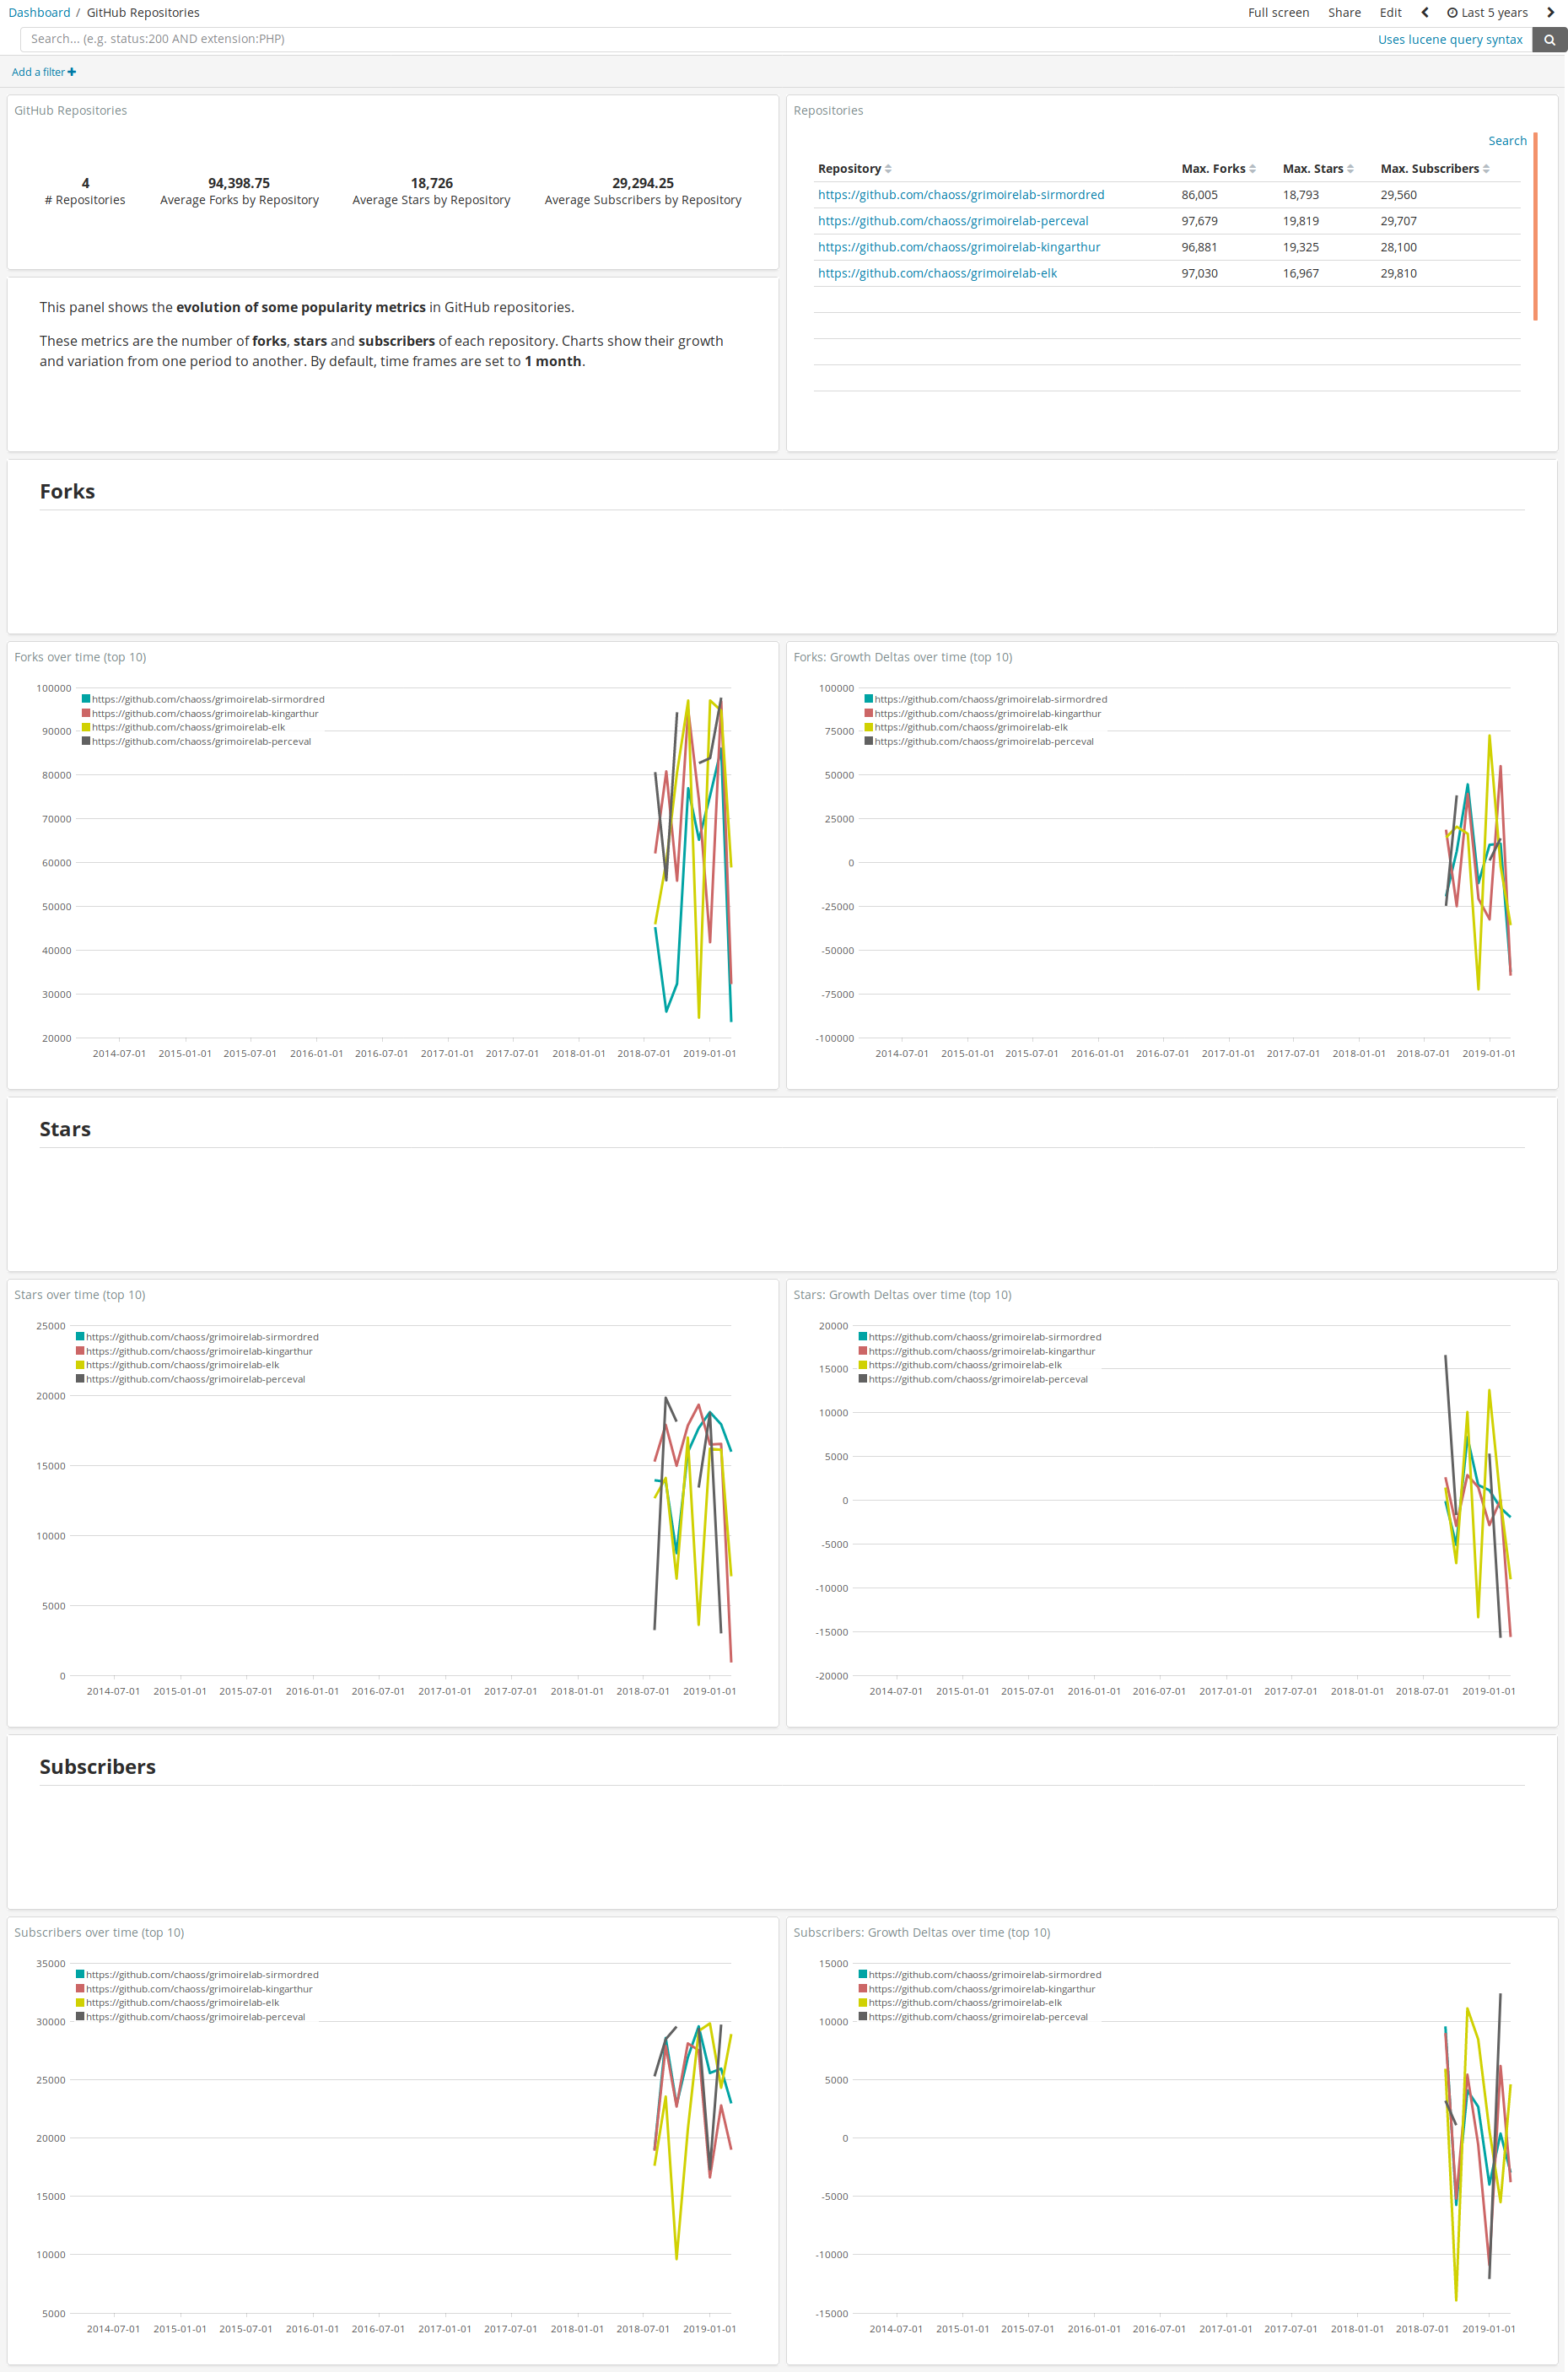
The GitHub Repositories panel shows information about the popularity of a repository in GitHub. The popularity is based in a set of indicators: the number of forks, times a repository has been stared and the number of subscriptions.
Metrics
From left to right and top to bottom, the metrics provided by each visualization are:
- GitHub Repositories: summary with the number of analyzed repositories and the average amount of forks, stars and subscribers per repository.
- Repositories: table with the maximum number of forks, stars and subscribers each repository has had. See below for more details.
Below these, there are two visualizations for each indicator: Evolution over time and Growth deltas over time.
-
Evolution over time: it shows the total or accumulated value of each indicator for each period. For example, if the number of forks was
100inJanuaryand inFebruaryit increased by50, the visualization will show150inFebruary. -
Growth deltas over time: it shows the variation of the indicator from one period to another. Taking the example from above, the the visualization will show
50forks forFebruary.
Please check some use notes below.
Use notes
-
Due to limitations in how Kibana performs certain queries, Repositories visualization only shows the maximum number of each indicator. It does not show its current value. Future versions of GrimoireLab will include a different type of items (events) where these values will be available.
-
Evolution visualizations are limited to the top 10 repositories for each indicator because more than that, will make the visualization illegible.
-
Evolution visualizations set periods of 1 month for one value to another.
Files
To use this dashboard with your own GrimoireLab deployment you need to:
- Check
github_repositoriesindex is available on your GrimoireLab instance (see grimoirelab-sirmordred documentation for details on how to deploy it). - Import the following JSON files using Kidash tool.
| Index Pattern | —– | Dashboard |
Command line instructions
Once you have the data in place, if you need to manually upload the dashboard execute the following commands:
kidash -e https://user:pass@localhost:443/data --import github_repositories-index-pattern.json
kidash -e https://user:pass@localhost:443/data --import github_repositories.json

Edit this doc