GitHub Devrel
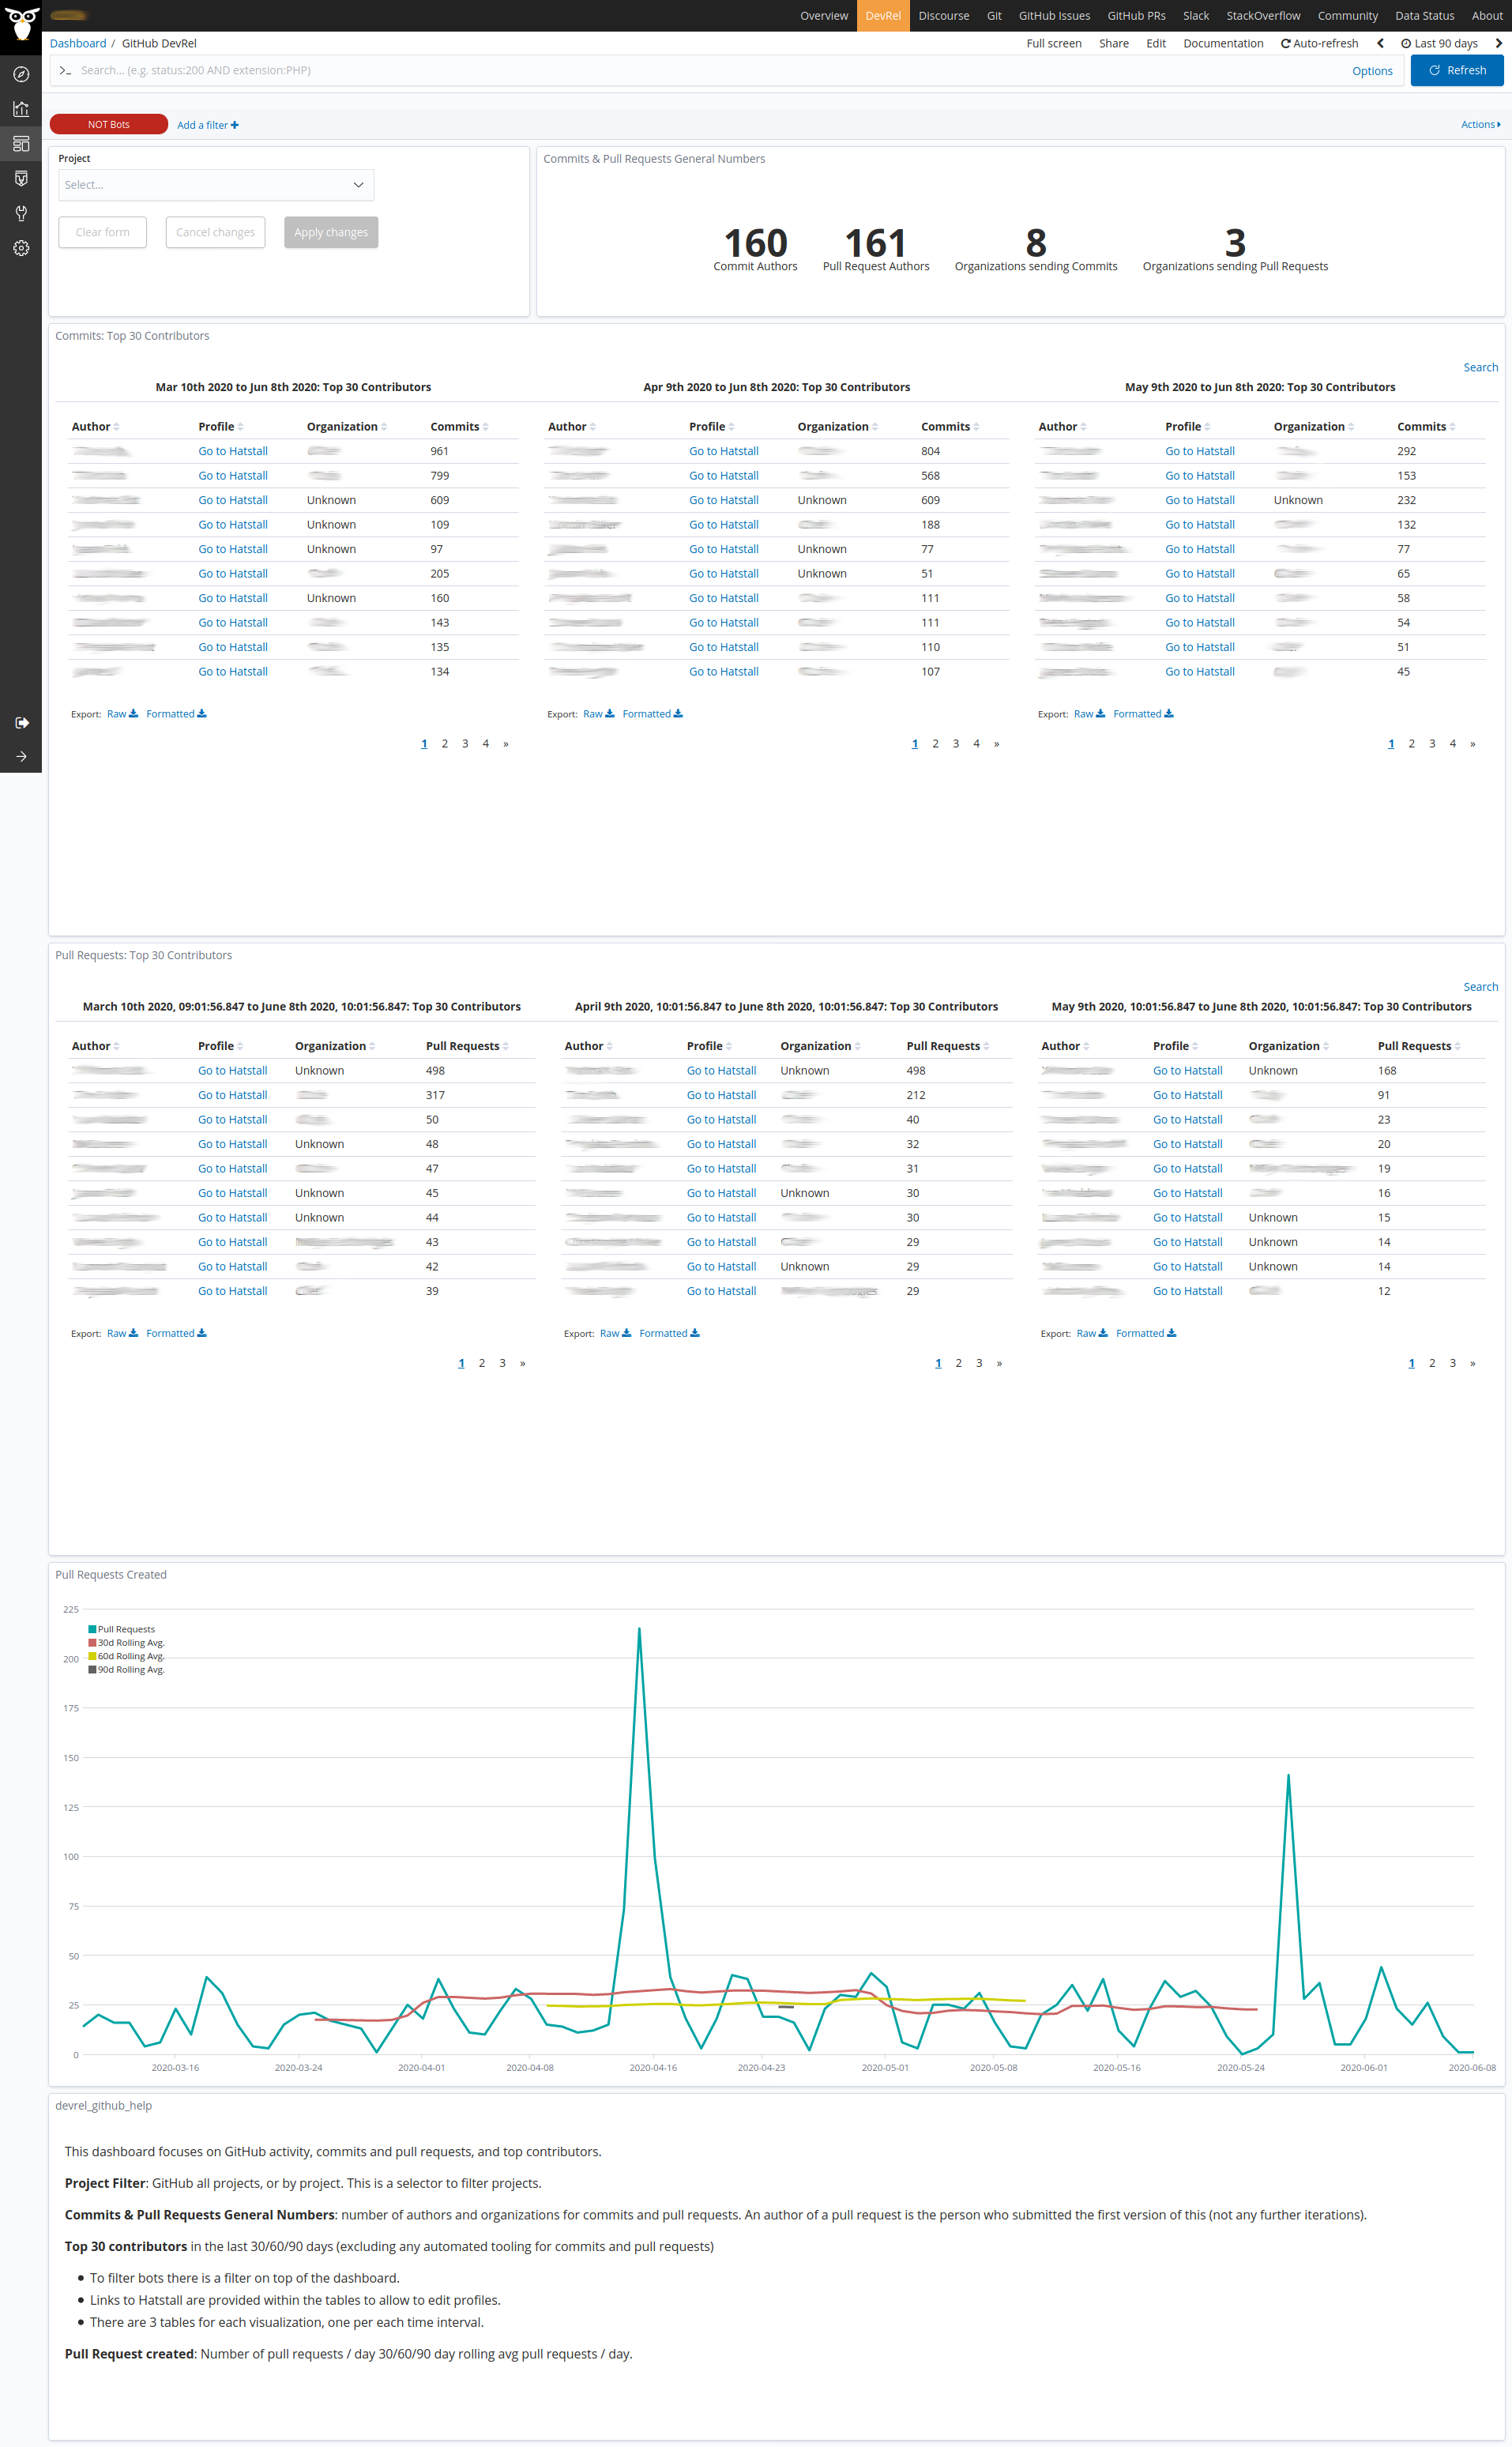
This dashboard focuses on GitHub activity, commits and pull requests, and top contributors.
To filter bots there is a filter on top of the dashboard.
- Links to Hatstall are provided within the tables to allow to edit profiles.
- There are 3 tables for each visualization, one per each time interval.
The visualizations you can find on the dashboard are:
- Project Filter: GitHub all projects, or by project. This is a selector to filter projects.
- Commits & Pull Requests General Numbers: number of authors and organizations for commits and pull requests. An author of a pull request is the person who submitted the first version of this (not any further iterations).
- Top 30 contributors in the last 30/60/90 days, for commits and Pull Requests, and excluding any automated tooling (see bots filter on top).
- Pull Request created: Number of pull requests / day 30/60/90 day rolling avg pull requests / day.
Acknowledgments
We would like to thank Frances Chao-Gay and benny Vasquez from chef.io project for their collaboration. This dashboard hadn’t been possible without them. It is based on their ideas and they were the actual reviewers of the work done.
We had also the opportunity of discussing the use case with benny during one of our bi-weekly CHAOSS-GrimoireLab calls, publicly available on YouTube.
Files
To use this dashboard with your own GrimoireLab deployment you need to:
- Check
all_enrichedindex is available on your GrimoireLab instance (grimoirelab-sirmordred automatically creates this alias for you). - Check
gitindex is available on your GrimoireLab instance (see grimoirelab-sirmordred documentation for details on how to deploy it). - Check
github_issuesindex is available on your GrimoireLab instance (see grimoirelab-sirmordred documentation for details on how to deploy it). - Import the following JSON files using Kidash tool.
| Index Patterns | —– | Dashboard |
Command line instructions
Once you have the data in place, if you need to manually upload the dashboard execute the following commands:
kidash -e https://user:pass@localhost:443/data --import all_enriched-index-pattern.json
kidash -e https://user:pass@localhost:443/data --import git-index-pattern.json
kidash -e https://user:pass@localhost:443/data --import github_issues-index-pattern.json
kidash -e https://user:pass@localhost:443/data --import github_devrel.json
Edit this doc