Jenkins Job Categories
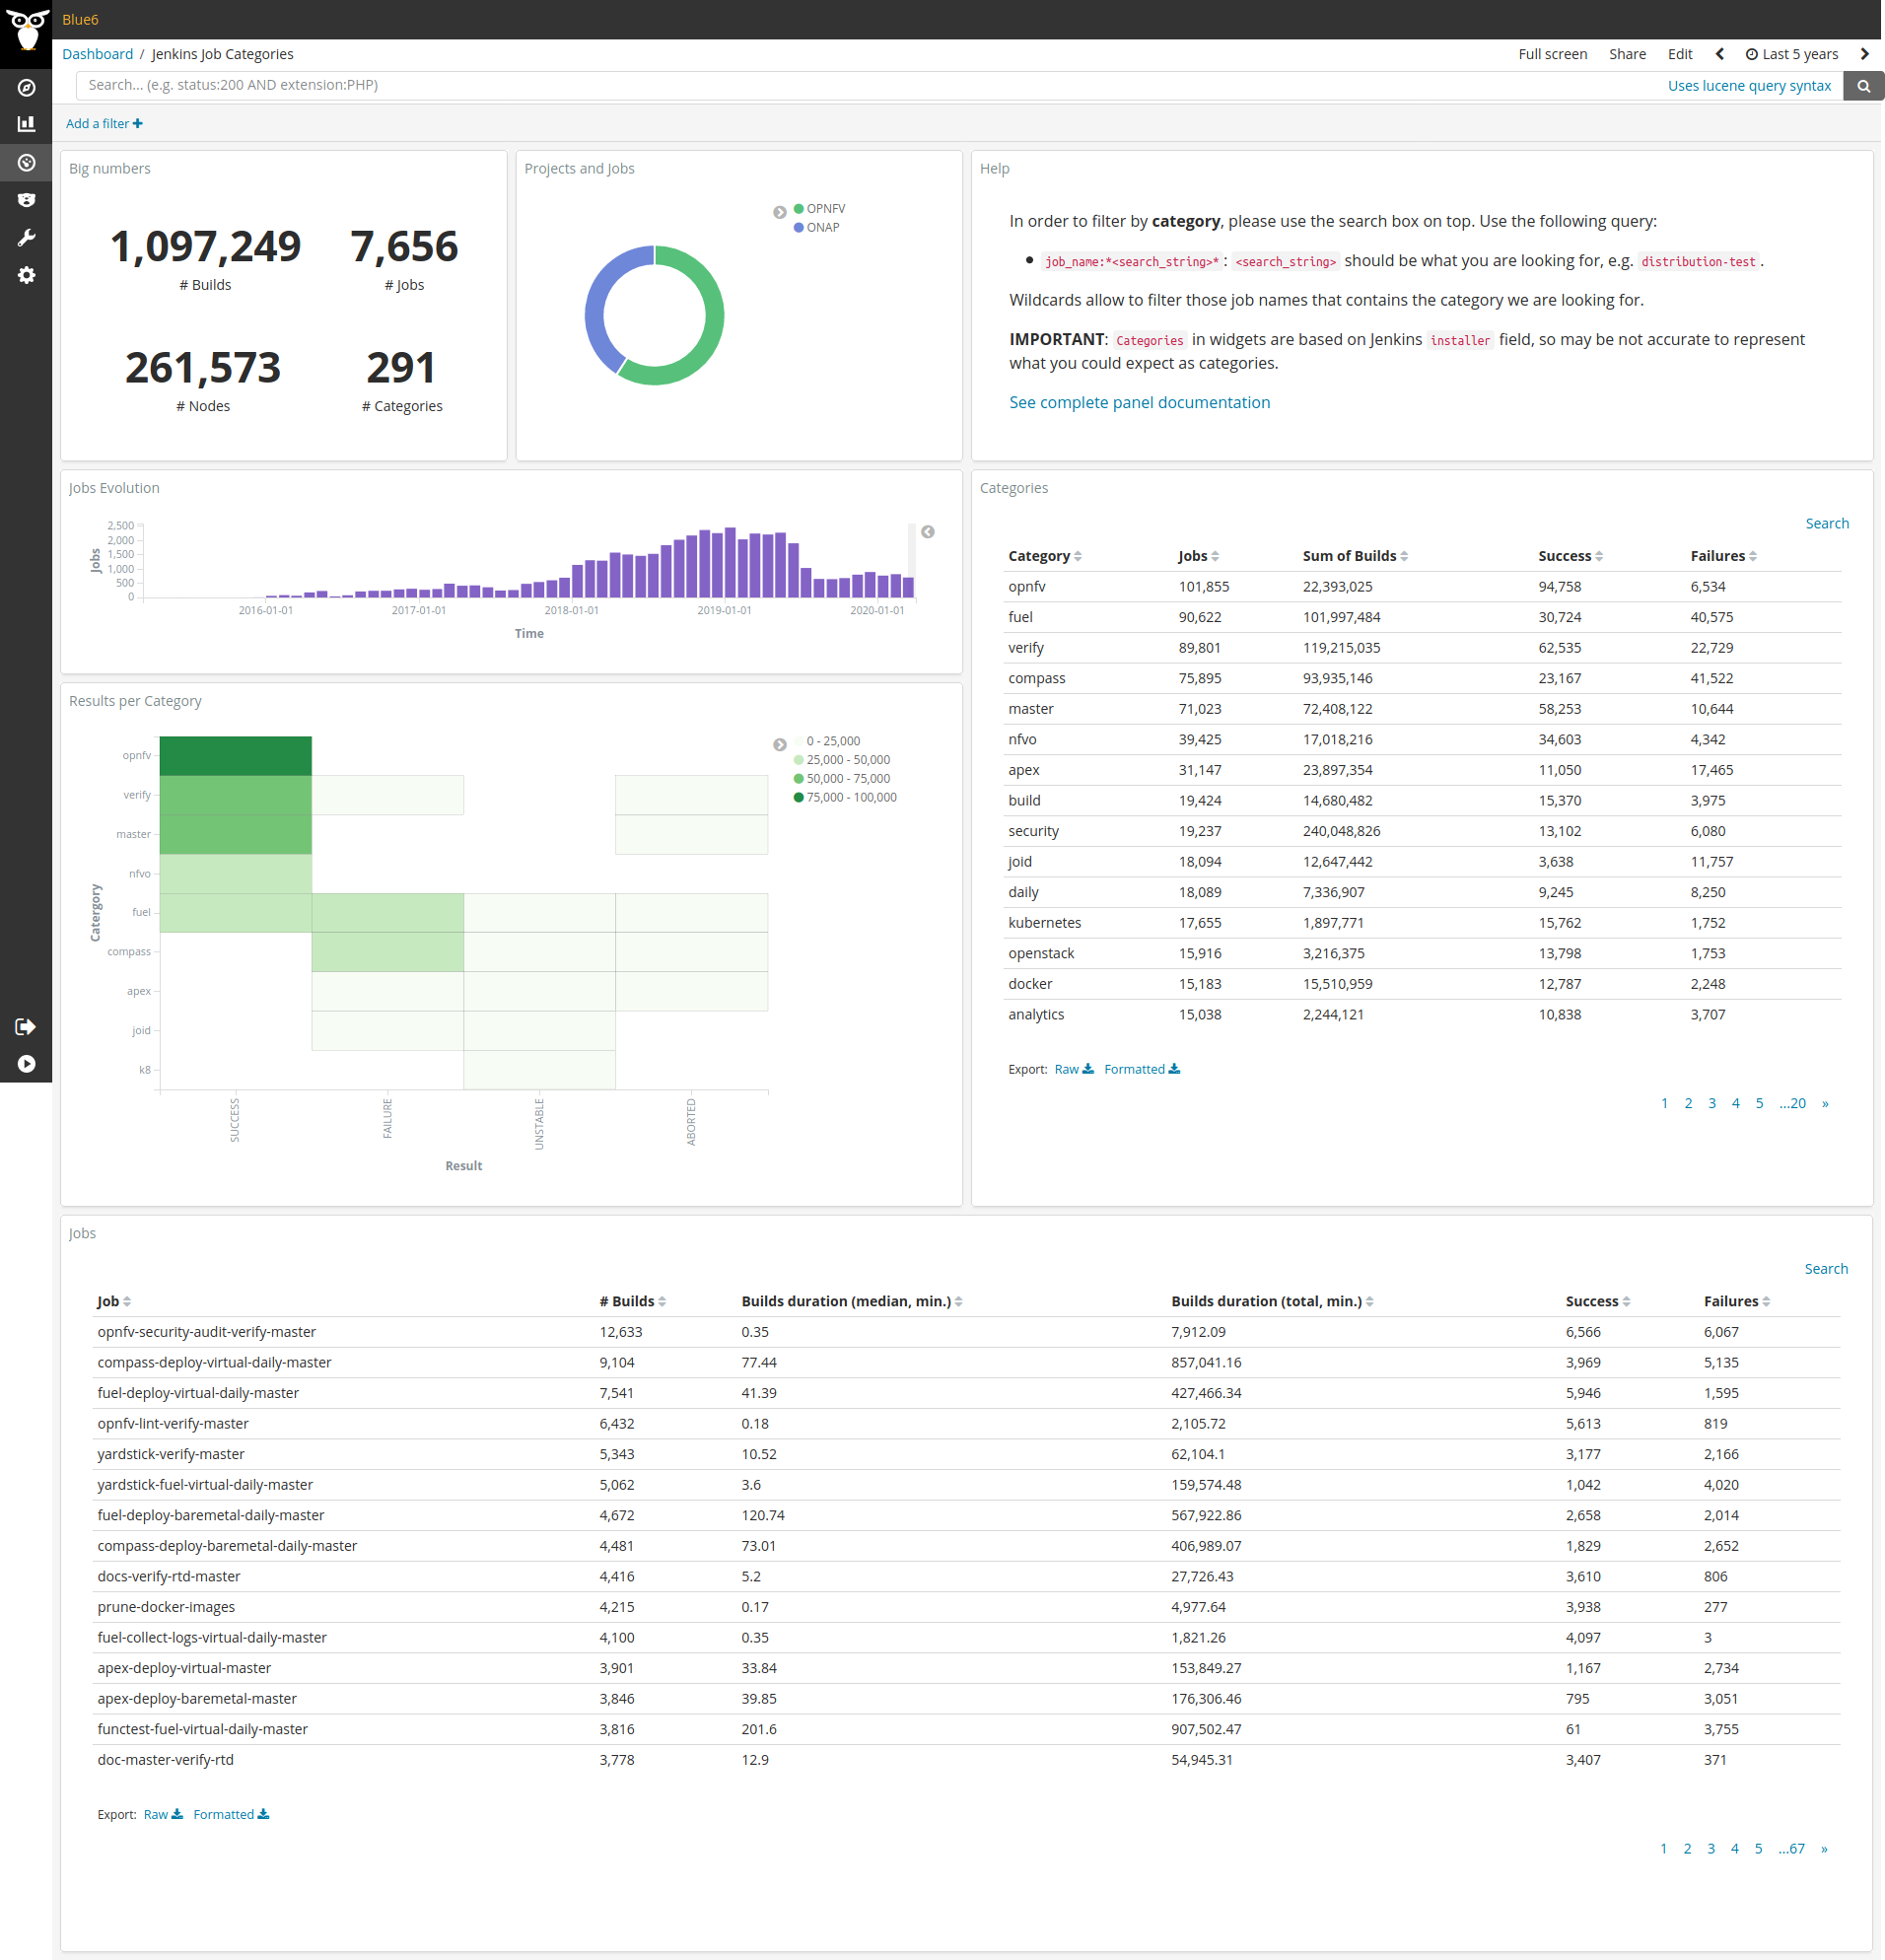
This panel is focused on offer a view of Jenkins data classified by job categories. The idea behind the panel is helping to identify those categories that are using more CI resources.
Filtering by Job Category
As Jenkins do not provide any particular field for category name, this panel
uses installer field. This may not correspond to actual categories.
However, filtering by job name allows us to visualize data corresponding to a given category. In order to filter by category, please use the search box on top and the following query:
job_name:*<search_string>*
Where <search_string> should be what you are looking for, e.g.
distribution-test. Wildcards(*) allow to filter those job names that
contains the category name we are looking for.
Metrics
From left to right and top to bottom, the metrics provided are:
- Big Numbers: total numbers about what we are visualizing in the panel.
- Projects and Jobs: a pie chart that shows the number of jobs per project.
- Jobs Evolution: number of jobs through time.
- Results per Category: heat map to visually identify categories with more runs and their results.
- Categories: aggregated numbers by category (actually by
installeras explained above). - Jobs: aggregated numbers by job name.
Files
To use this dashboard with your own GrimoireLab deployment you need to:
- Check
jenkinsindex is available on your GrimoireLab instance (see grimoirelab-sirmordred documentation for details on how to deploy it). - Import the following JSON files using Kidash tool.
| Index Pattern | —– | Dashboard |
Command line instructions
Once you have the data in place, if you need to manually upload the dashboard execute the following commands:
kidash -e https://user:pass@localhost:443/data --import jenkins-index-pattern.json
kidash -e https://user:pass@localhost:443/data --import jenkins_job_categories.json
Edit this doc