Jenkins Jobs
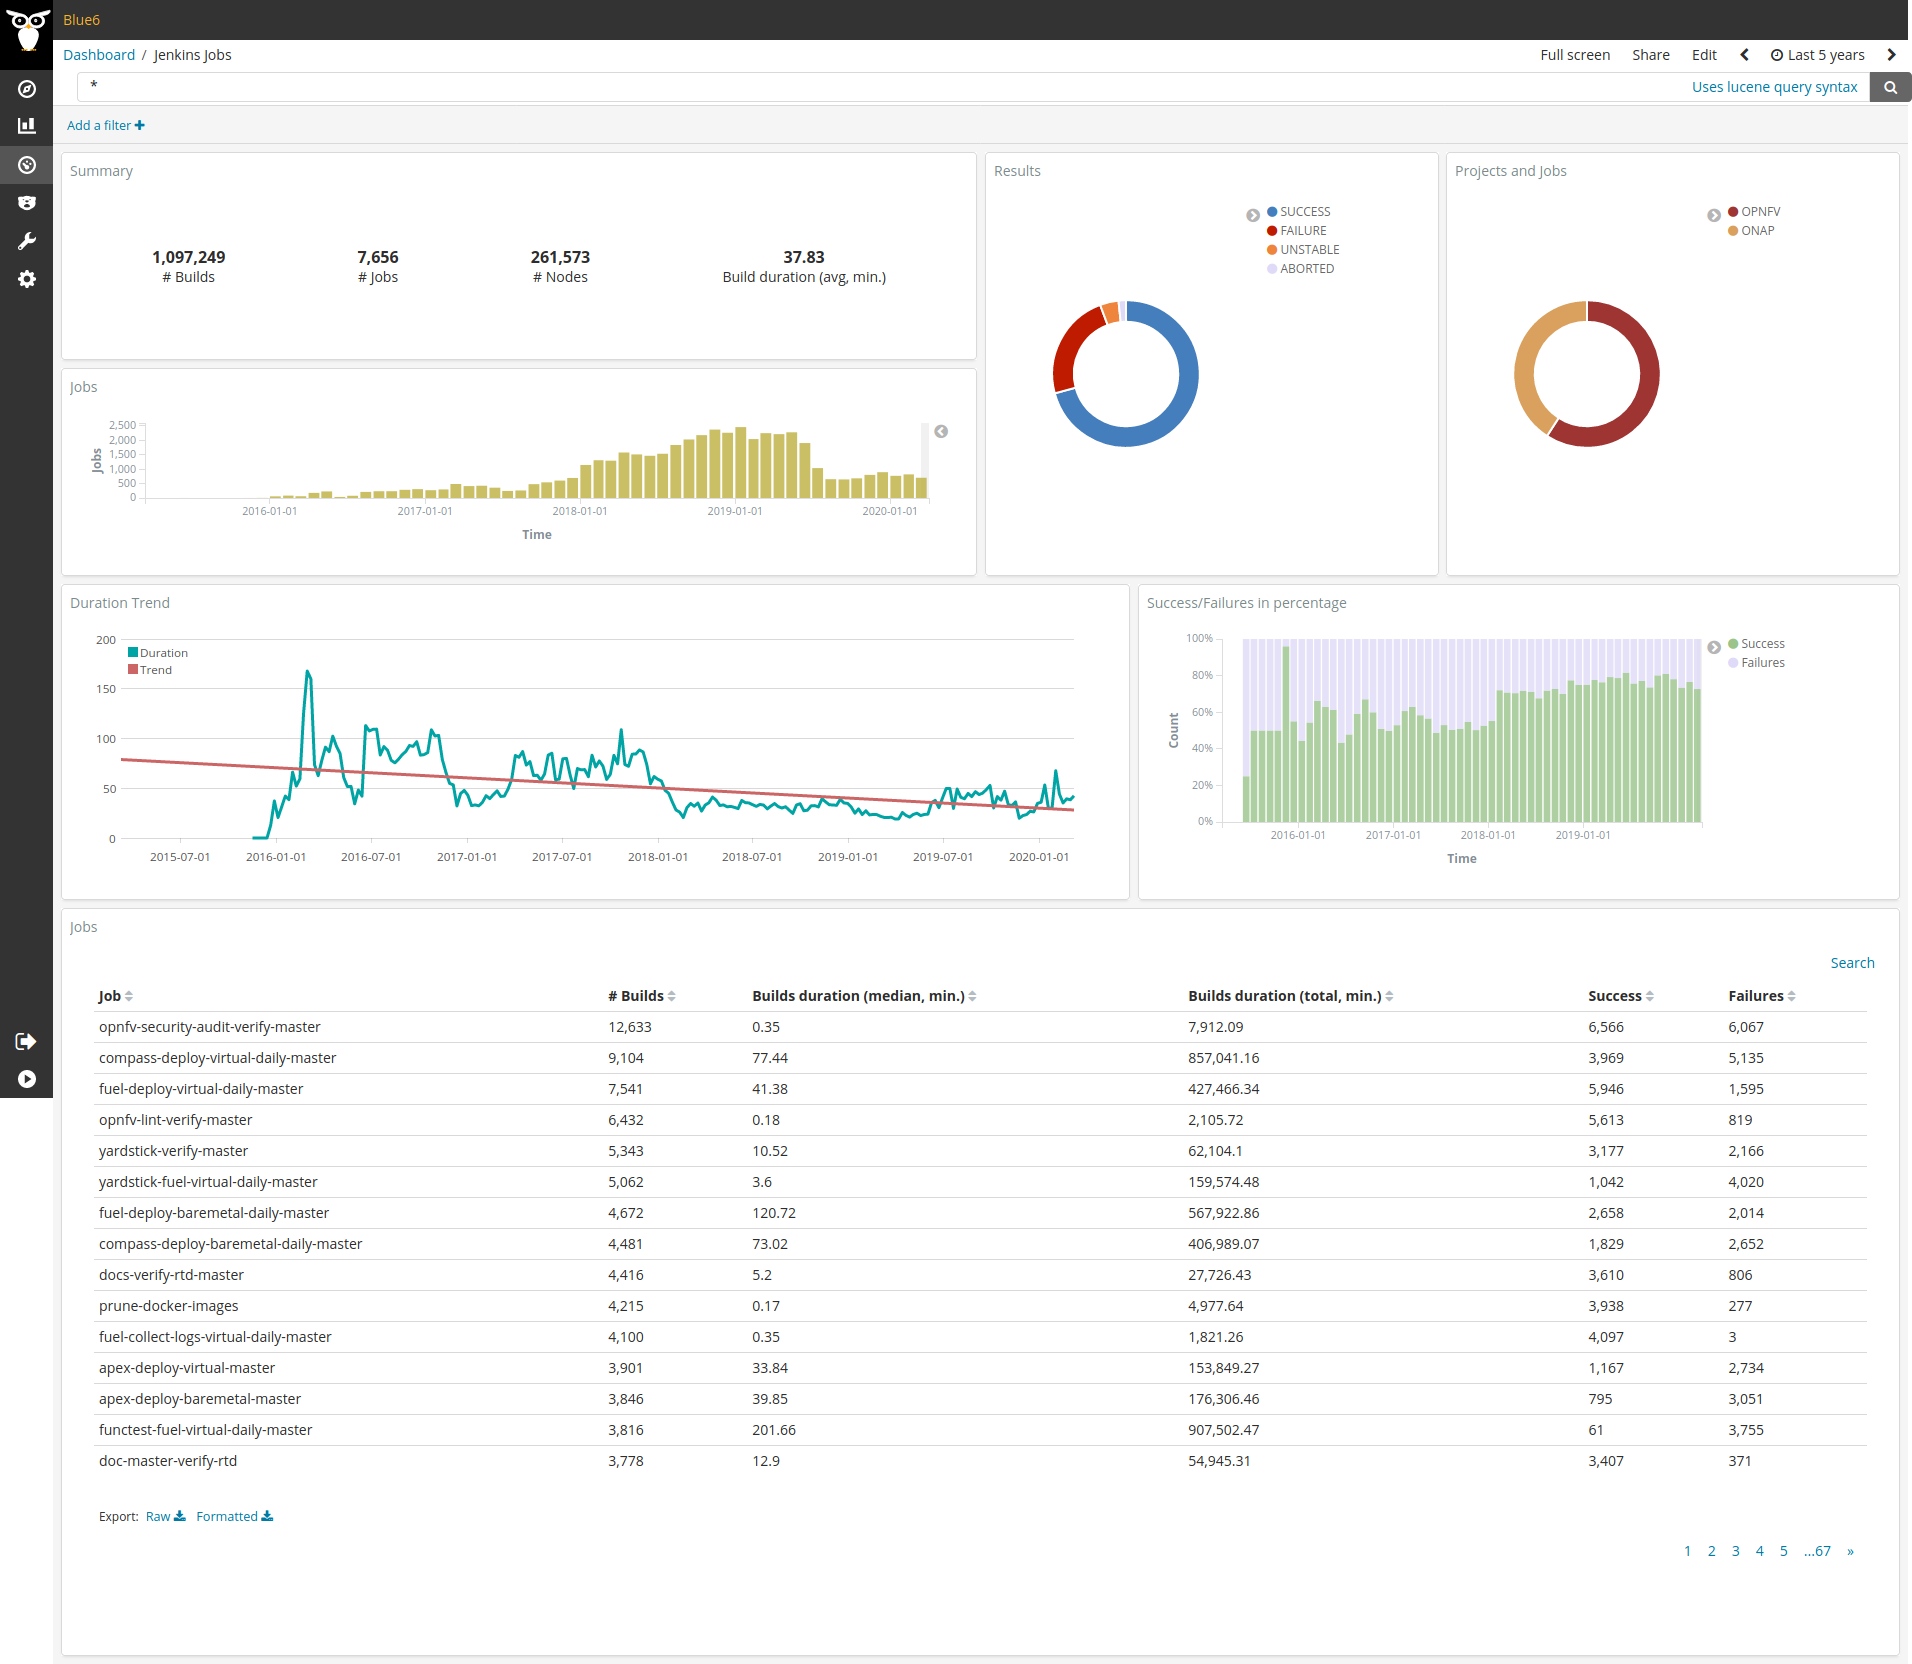
This panel provides an overview of the jobs executed in the Jenkins instances.
Metrics
From left to right and top to bottom, the metrics provided are:
- Summary: total numbers of builds, jobs, nodes and build durations.
- Results: a pie chart that summarizes the proportions of the build results (success, failure, unstable, aborted).
- Projects and Jobs: a pie chart that highlights the number of jobs per project.
- Jobs: a bar chart that shows the evolution of the jobs.
- Duration Trend: a line chart that shows the evolution of the build durations.
- Success/Failures in percentage: a stacked bar chart that allows to compare the proportion of build success and failures.
- Jobs: a table that details the number of builds, durations, success and failures per job.
Files
To use this dashboard with your own GrimoireLab deployment you need to:
- Check
jenkinsindex is available on your GrimoireLab instance (see grimoirelab-sirmordred documentation for details on how to deploy it). - Import the following JSON files using Kidash tool.
| Index Pattern | —– | Dashboard |
Command line instructions
Once you have the data in place, if you need to manually upload the dashboard execute the following commands:
kidash -e https://user:pass@localhost:443/data --import jenkins-index-pattern.json
kidash -e https://user:pass@localhost:443/data --import jenkins_jobs.json
Edit this doc