Jira Backlog
This dashboard focuses on pending issues, that is, those Issues that remain open (note that here we work with data retrieved in the moment of dashboard creation).
It is possible to filter data in the same way as in other Jira panels (by submitter, repositories, and status).
A list with the oldest Issues is also shown, providing direct links to them and some basic information as their titles, how long they have been open and when they were created.
Metrics
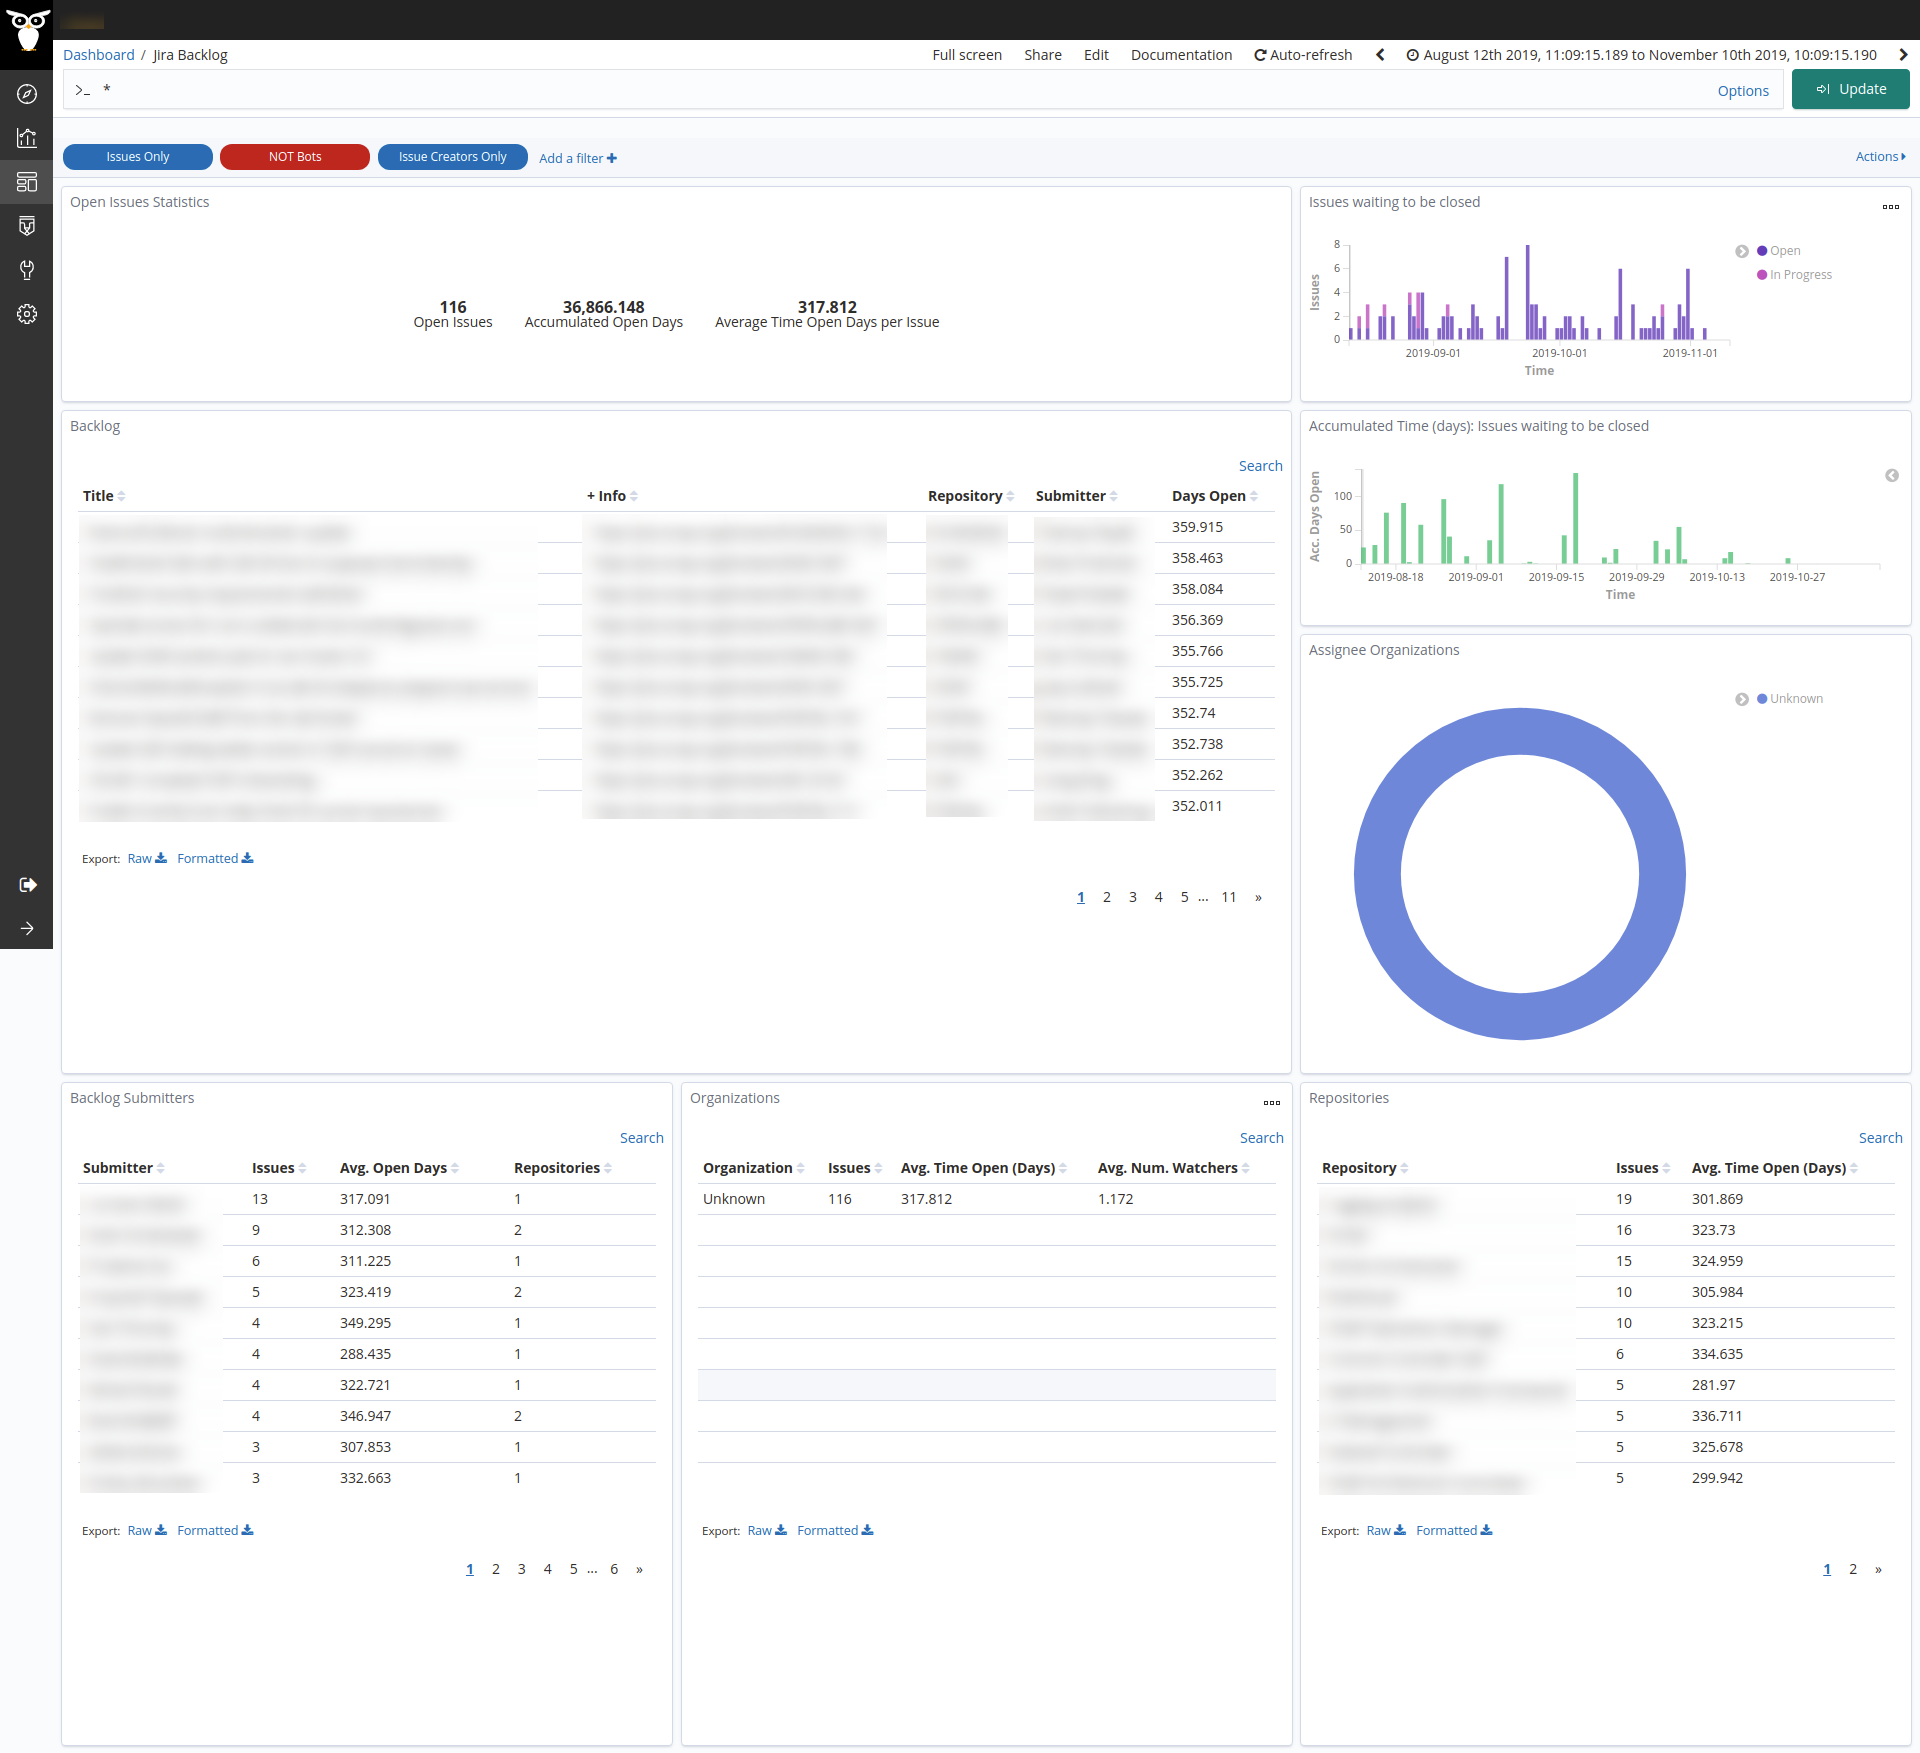
The metrics provided are:
- Open Issues Statistics: total numbers of open issues, accumulated open days, and the average time the issues have been open (days).
- Issues waiting to be closed: a bar chart that shows the evolution of the status of the open issues over time.
- Backlog: a table separated by the title of the issues that details the issue URL, repositories, submitters, and the number of the day that the issue has been open.
- Accumulated Time (days): Issues waiting to be closed: a bar chart that shows the evolution of the accumulated open issues (days).
- Assignee Organizations: a pie chart that summarizes the issues by the assignees’ organization.
- Backlog Submitters: a table sorted by submitters that details the number of issues, average time the issues have been open (days), and repositories.
- Organizations: a table sorted by organizations that details the number of open issues, average time the issues have been open (days), and the average of the number of the watchers.
- Repositories: a table sorted by repositories that details the number of open issues and the average time the issues have been open (days).
Known Limitations
To be able to properly calculate the time a given ticket has been in open state we need to relay on a painless
scripted field called painless_delay. The idea behind the field is:
- If the ticket is still open,
painless_delaywill be the time from its creation to now. - If it is already closed,
painless_delaywill be the time from its creation to the moment it was closed (resolution_date).
Unfortunately, we found corner cases in which Jira doesn’t provide all the information we need. The actual cases
covered by painless_delay scripted field are:
diff(grimoire_creation_date, resolution_date): If the issue is already closed,resolution_dateexists, andstatusisCloseorDone.time_to_close_days(pre-computed field storing the time closed issues were open): If the issue is closed,resolution_datedoesn’t exist or status is notCloseorDone.diff(grimoire_creation_date, now): If the issue is still open.
Files
To use this dashboard with your own GrimoireLab deployment you need to:
- Check
jiraindex is available on your GrimoireLab instance (see grimoirelab-sirmordred documentation for details on how to deploy it). - Import the following JSON files using Kidash tool.
| Index Pattern | —– | Dashboard |
Command line instructions
Once you have the data in place, if you need to manually upload the dashboard execute the following commands:
kidash -e https://user:pass@localhost:443/data --import jira-index-pattern.json
kidash -e https://user:pass@localhost:443/data --import jira_backlog.json
Edit this doc