Jira Timing
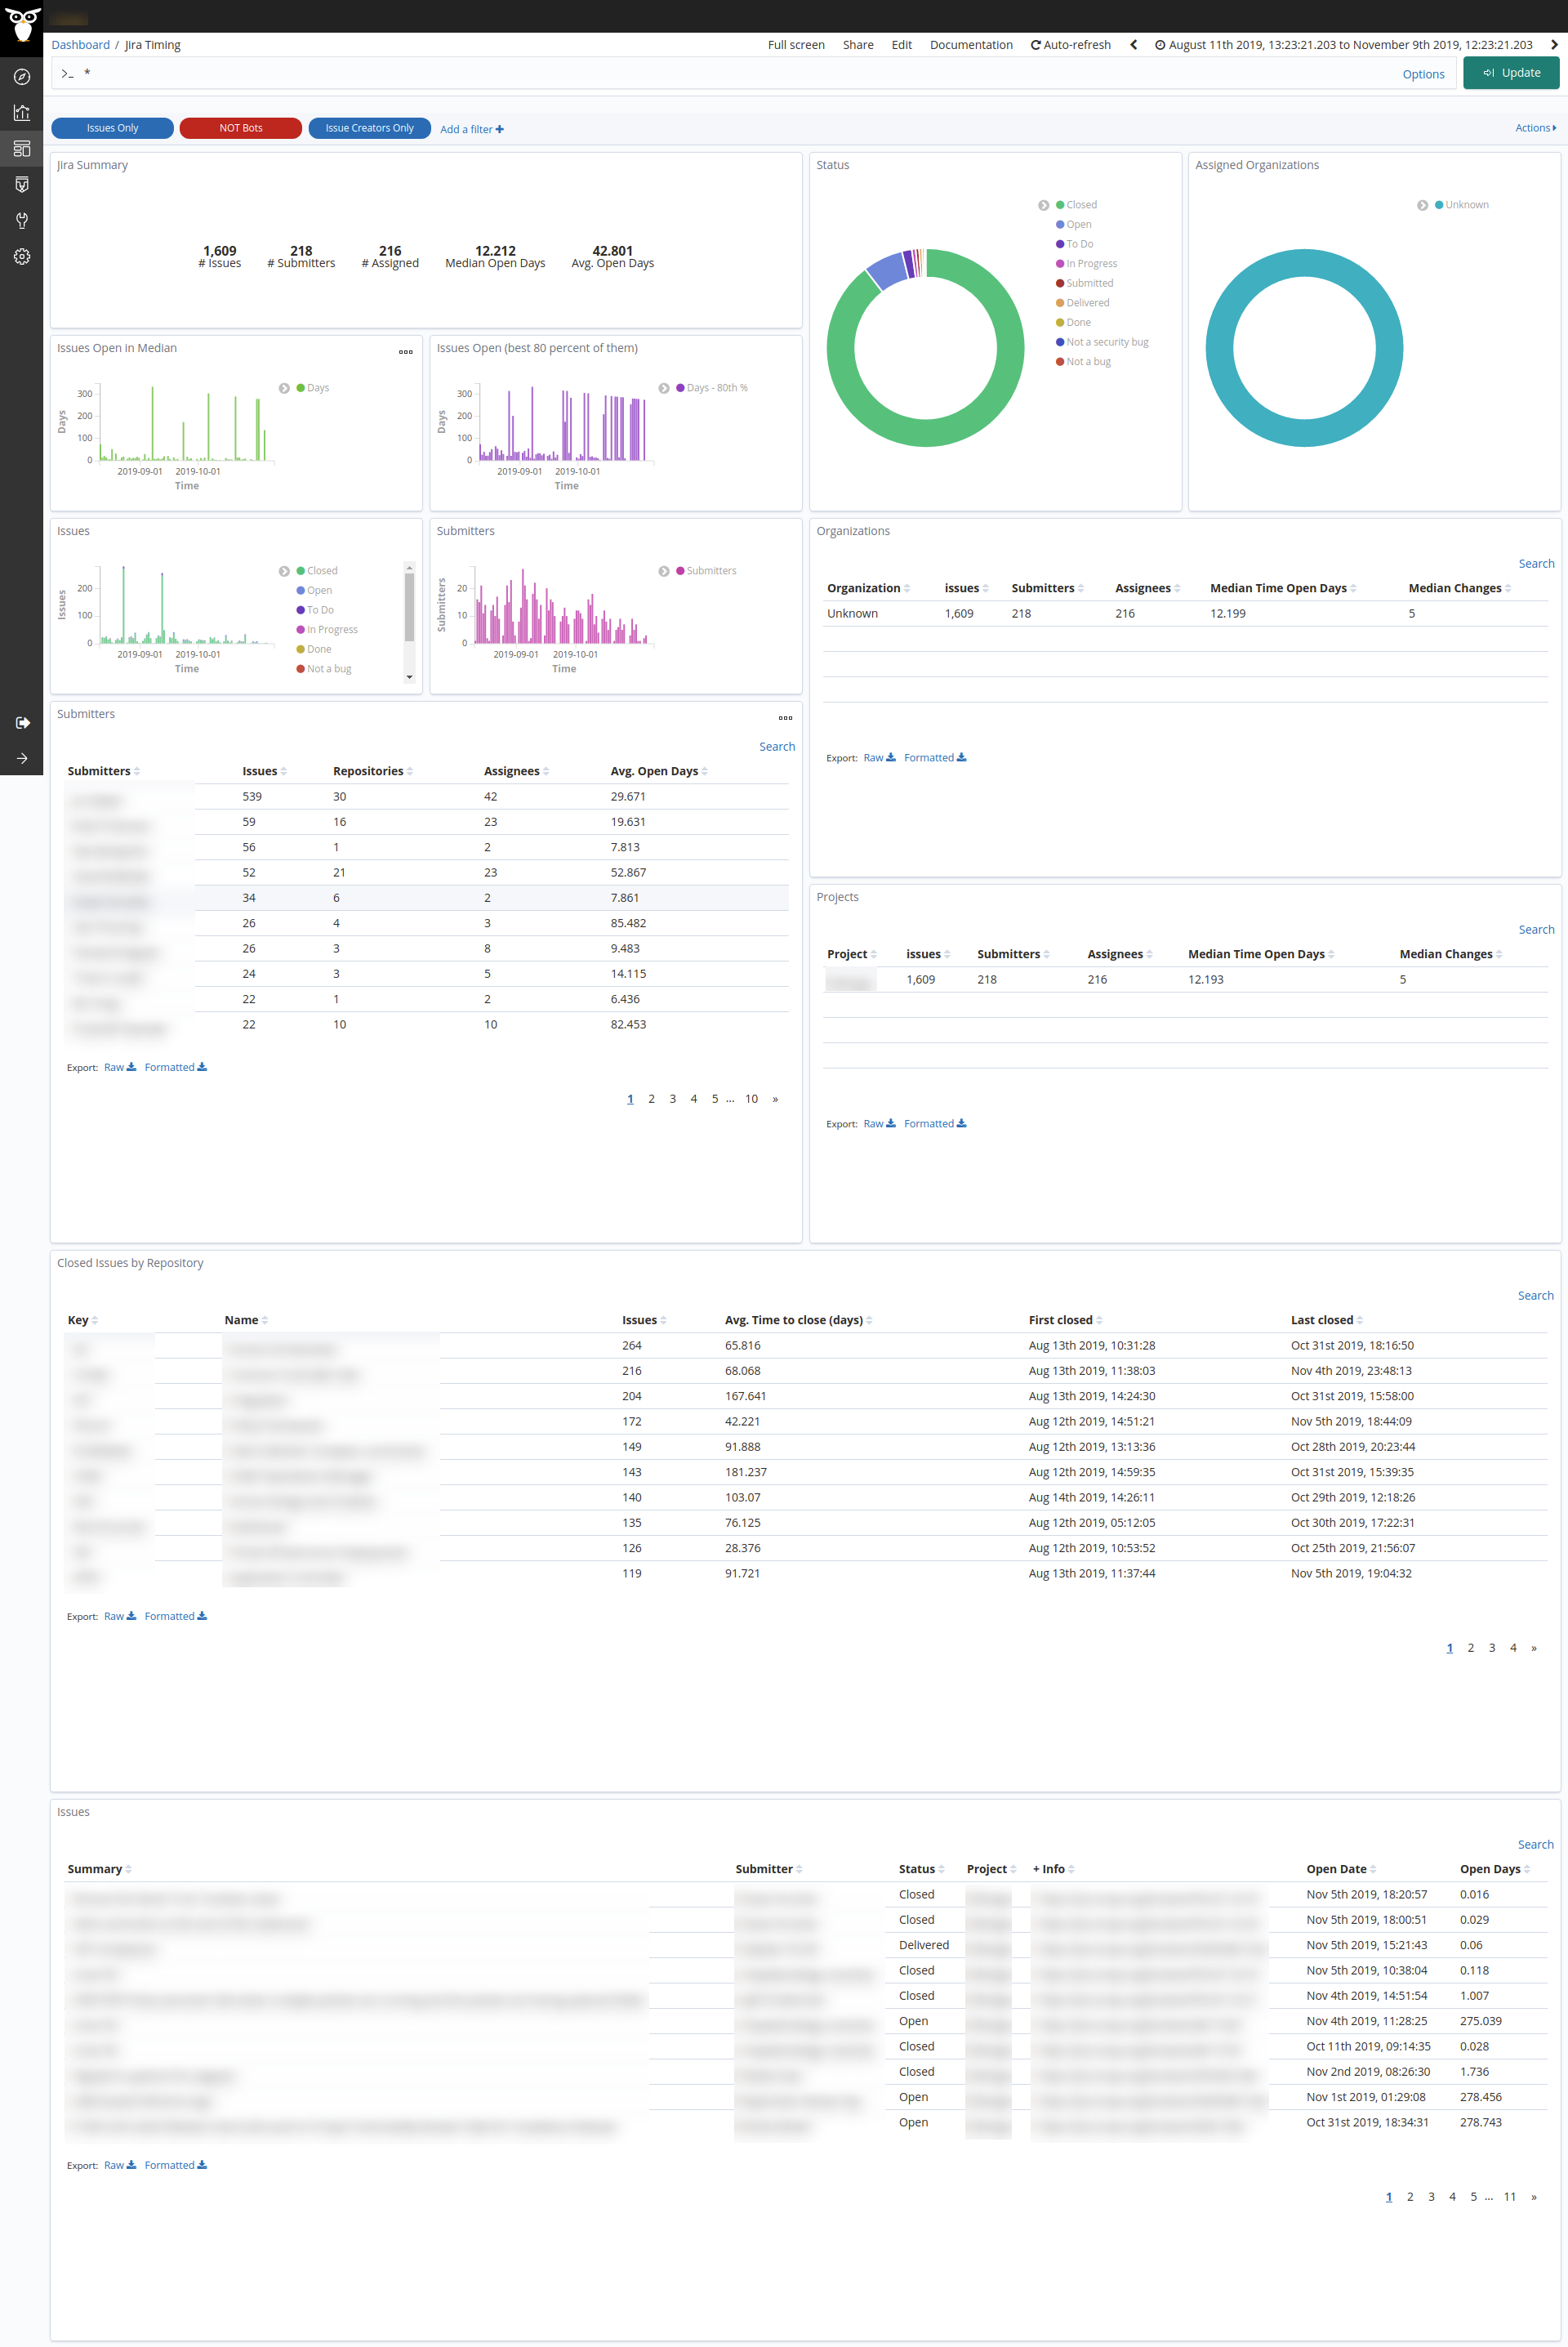
This dashboard contains information about the evolution of tickets over time. It shows submitters, repositories and status of the tickets, and gives also insights about the time to process them.
Among other information we can find statistical information on closing times and also tables with the latest and the oldest Issues.
Metrics
The metrics provided are:
- Jira Summary: total numbers of issues, submitters, assignees, median of the time the issue stay open (days), and average of the time the issue stay open (days).
- Issues Open in Median (Days): a bar chart that shows the evolution of the median of the time the issues stay open (days).
- Issues Open (best 80 Percent of them) (Days): a bar chart that shows the evolution of the 80 percentile of the time the issues stay open (days).
- Status: a pie chart that summarizes the proportion of the issues by status.
- Assigned Organizations: a pie chart that summarizes the issues by the submitters’ organization.
- Issues: a bar chart that shows the evolution of the number of issues over time.
- Submitters: a bar chart that shows the evolution of the number of submitters over time.
- Organizations: a table sorted by organizations that details the number of issues open, submitters, assignees, median of the time the issue stay open (days), and the average time the issues have been open (days).
- Submitters: a table sorted by submitters that details the number of issues, repositories, assignees, and the average time the issues have been open (days).
- Projects: a table sorted by projects that details the number of issues, submitters, assignees, median of the time the issue stay open (days), and median the issue has been changed.
- Closed Issues by Repository: a table sorted by the number of issues that details the project key, project name, number of issues, average time the issues have been open (days), first issue closed, and last issue closed.
- Issues: a table sorted by open date of issues that details the summary, submitter, status, project, issue URL, open date, and the time the issue stay open (days).
Known Limitations
To be able to properly calculate the time a given ticket has been in open state we need to relay on a painless
scripted field called painless_delay. The idea behind the field is:
- If the ticket is still open,
painless_delaywill be the time from its creation to now. - If it is already closed,
painless_delaywill be the time from its creation to the moment it was closed (resolution_date).
Unfortunately, we found corner cases in which Jira doesn’t provide all the information we need. The actual cases
covered by painless_delay scripted field are:
diff(grimoire_creation_date, resolution_date): If the issue is already closed,resolution_dateexists, andstatusisCloseorDone.time_to_close_days(pre-computed field storing the time closed issues were open): If the issue is closed,resolution_datedoesn’t exist or status is notCloseorDone.diff(grimoire_creation_date, now): If the issue is still open.
Files
To use this dashboard with your own GrimoireLab deployment you need to:
- Check
jiraindex is available on your GrimoireLab instance (see grimoirelab-sirmordred documentation for details on how to deploy it). - Check
jira_resolution_date-index-patternindex is available on your GrimoireLab instance (grimoirelab-sirmordred automatically creates this alias for you). - Import the following JSON files using Kidash tool.
| Index Patterns | —– | Dashboard |
Command line instructions
Once you have the data in place, if you need to manually upload the dashboard execute the following commands:
kidash -e https://user:pass@localhost:443/data --import jira-index-pattern.json
kidash -e https://user:pass@localhost:443/data --import jira_resolution_date-index-pattern.json
kidash -e https://user:pass@localhost:443/data --import jira_timing.json
Edit this doc