Jira
This panel summarizes all the activity related to Jira issues. It is focused in the number of issues submitted, the people reporting them and how long takes issues remain opened or to close them.
This panel gives also special attention to the organizations related to these issues, the projects and the repositories where they were submitted.
Note there is a blue filter on top for filtering in issues, so comments
are excluded from panel calculations although they are also stored in the
index. A field named type allows us to differentiate between them.
Metrics
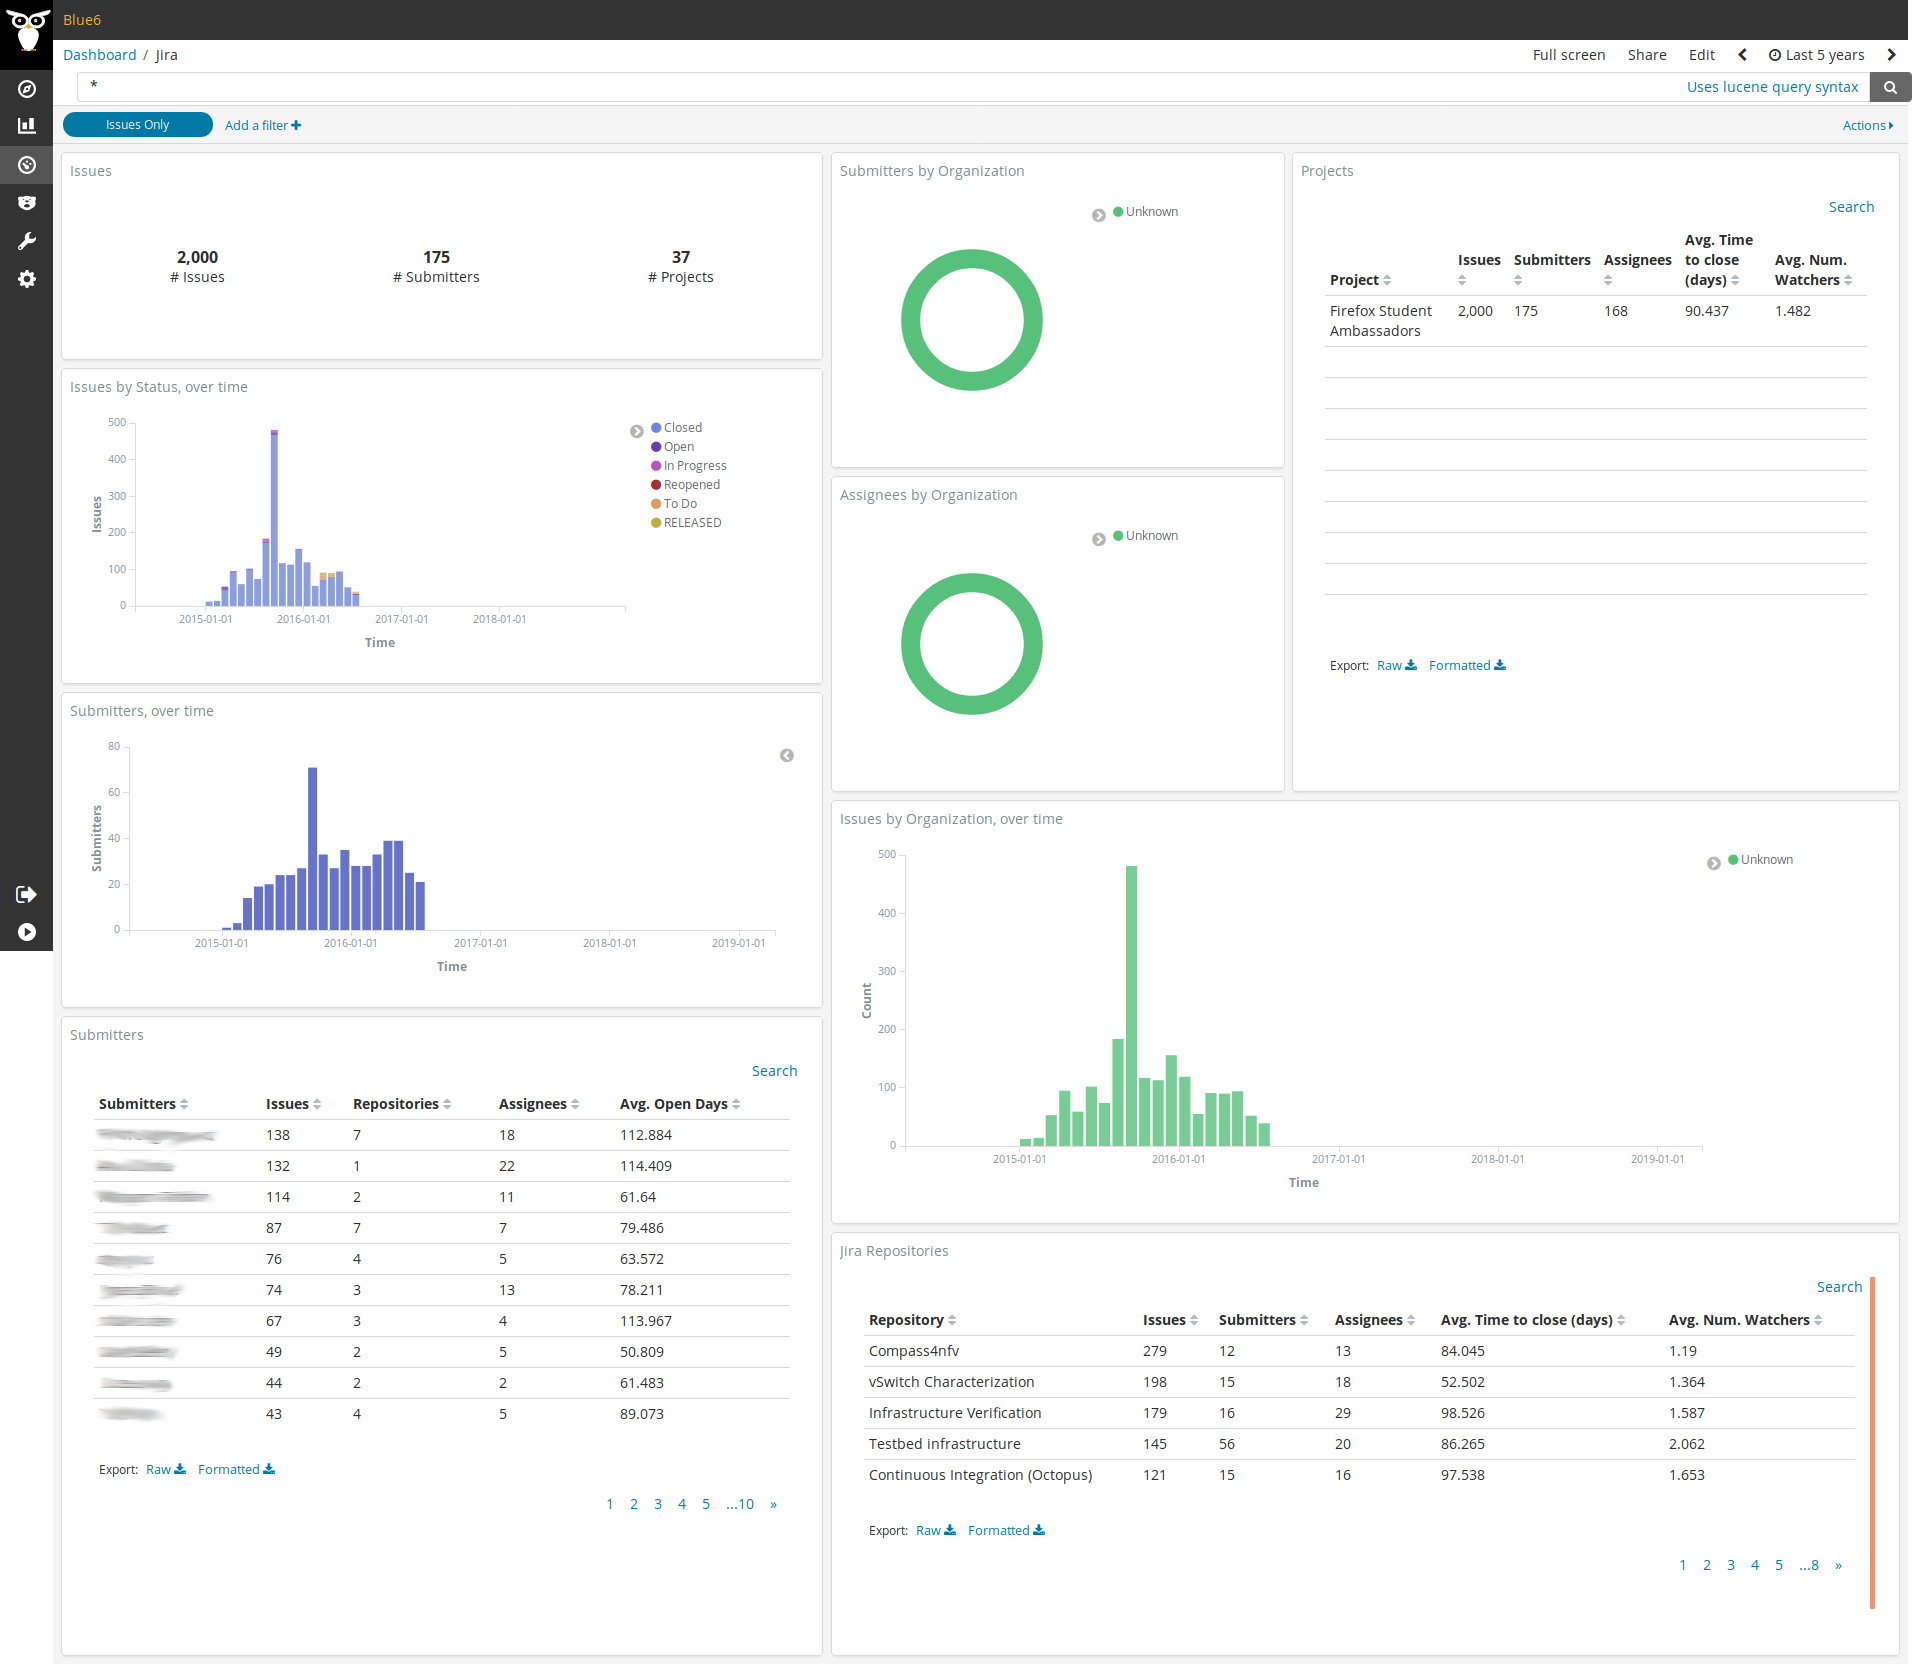
From left to right and top to bottom, the metrics provided are:
- Issues: total numbers of issues, submitters and projects tracked by the platform.
- Submitters by Organization: pie chart showing the number of issues submitted by members of the same organization.
- Assignees by Organization: pie chart with the number of issues that are currently assigned to members of the same organization.
- Projects: table with stats as the number of issues or assigness by project.
- Issues by Status, over time: this bars chart shows the number of issues by status that were opened on each period of time.
- Submitters, over time: bars chart with the number of different submitters for each period of time.
- Issues by Organization, over time: it shows the number of issues opened by the same organization for each period of time.
- Submitters: table with the top submitters that contains several stats regarding the number of submitted issues, the number of repositories where she collaborated or the average in days her tickets are/were remained open.
- Jira repositories: table with the activity per repository and the average time to close an issue.
Known Limitations
To be able to properly calculate the time a given ticket has been in open state we need to relay on a painless
scripted field called painless_delay. The idea behind the field is:
- If the ticket is still open,
painless_delaywill be the time from its creation to now. - If it is already closed,
painless_delaywill be the time from its creation to the moment it was closed (resolution_date).
Unfortunately, we found corner cases in which Jira doesn’t provide all the information we need. The actual cases
covered by painless_delay scripted field are:
diff(grimoire_creation_date, resolution_date): If the issue is already closed,resolution_dateexists, andstatusisCloseorDone.time_to_close_days(pre-computed field storing the time closed issues were open): If the issue is closed,resolution_datedoesn’t exist or status is notCloseorDone.diff(grimoire_creation_date, now): If the issue is still open.
Files
To use this dashboard with your own GrimoireLab deployment you need to:
- Check
jiraindex is available on your GrimoireLab instance (see grimoirelab-sirmordred documentation for details on how to deploy it). - Import the following JSON files using Kidash tool.
| Index Pattern | —– | Dashboard |
Command line instructions
Once you have the data in place, if you need to manually upload the dashboard execute the following commands:
kidash -e https://user:pass@localhost:443/data --import jira-index-pattern.json
kidash -e https://user:pass@localhost:443/data --import jira.json
Edit this doc