Organizational Diversity by domains
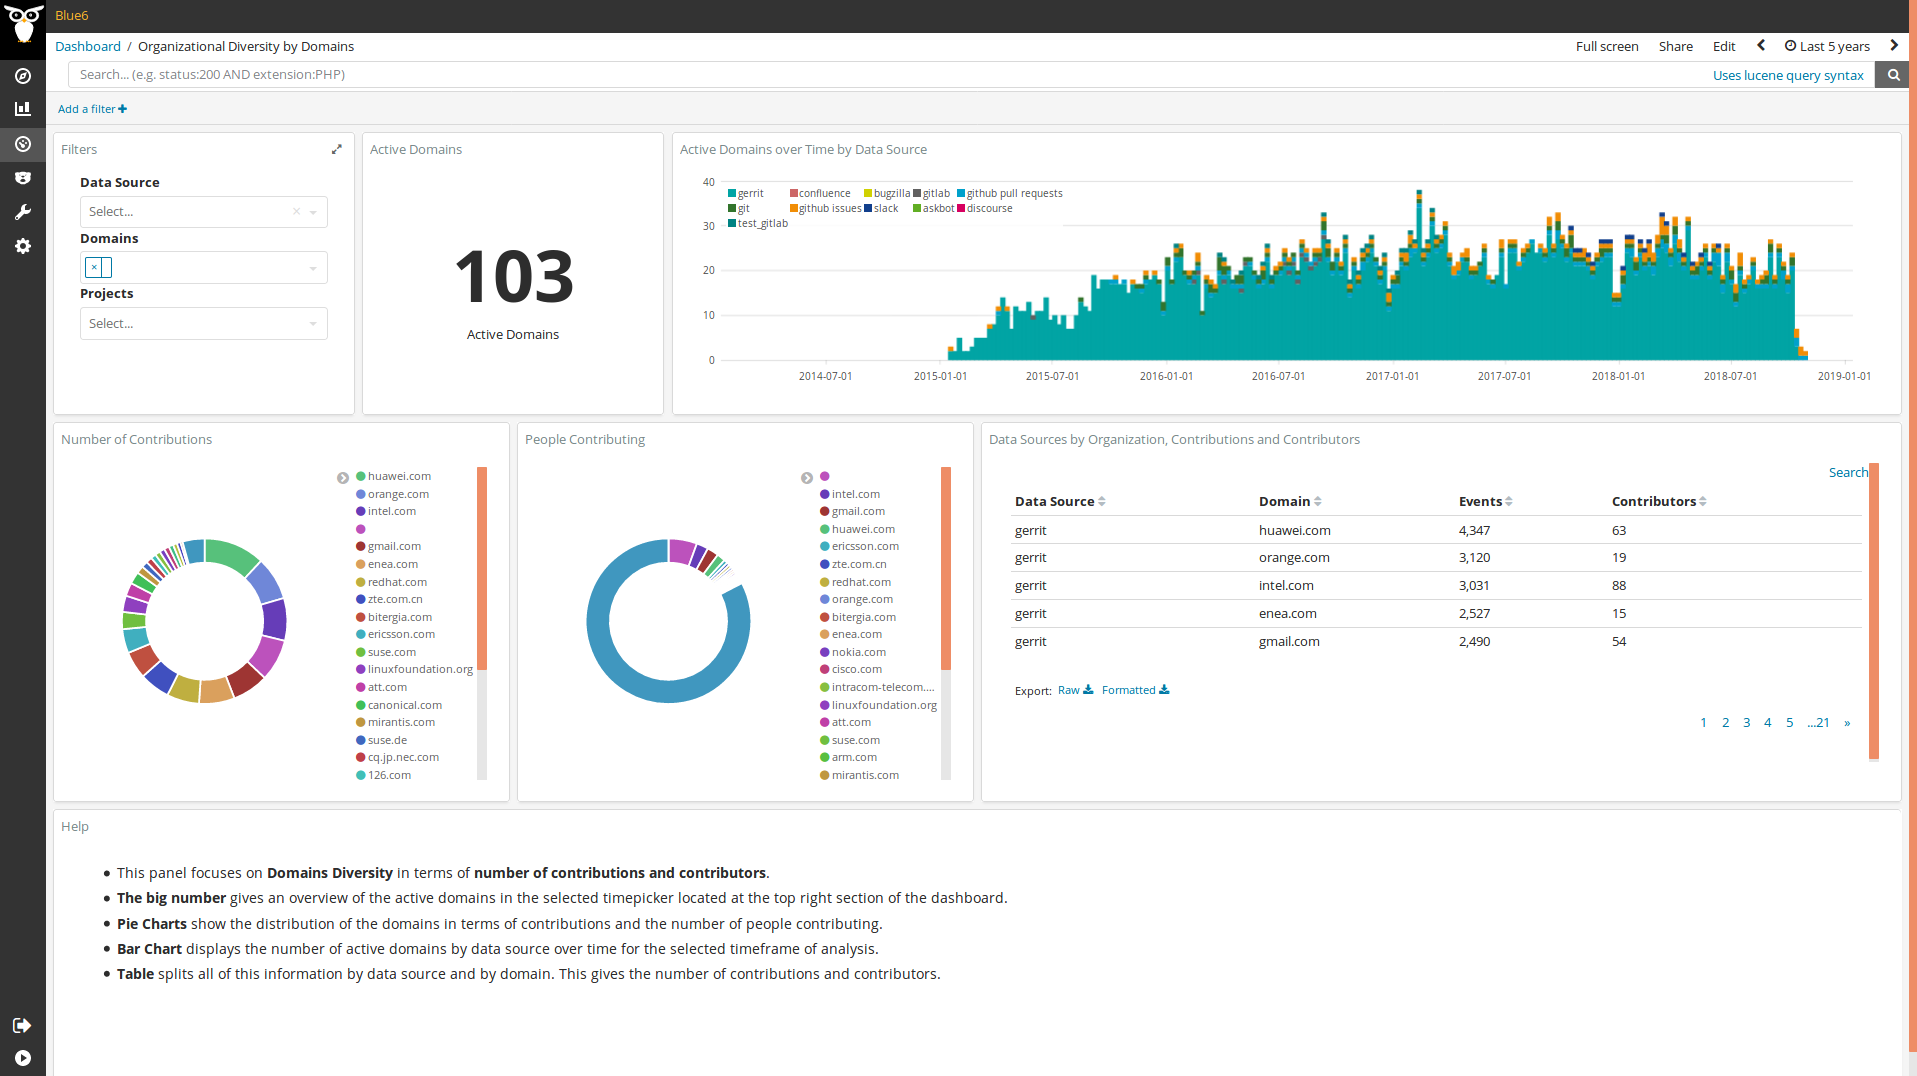
This panel aims at providing a view of the diversity in terms of domains in a project. A domain is the domain used by the contributor in any data source. The goal of this panel is to show how many active domains there are in a specific timeframe of activity together with their evolution over time. This information can be filtered by data source.
Metrics
From left to right and top to bottom, the metrics provided are:
- Active Domains: total number of unique active organizations in any data source.
- Active Domains over Time by Data Source: evolutionary chart displaying the number of active domains for each data source.
- Number of Contributions: each slice in the pie chart is a domain. The bigger the slice the more contributions were done by such domain.
- People Contributing: each slice in the pie chart is a domain. The bigger the slice the more people contributing from such domain.
- Data Sources by Domain, Contributions and Contributors: this tables displays all of the information available for this panel, but ordered in a table. This has four columns that are the data source, the domain, the number of contributions across all of the data sources and the number of contributors across those data sources.
In addition to Kibana filters and search box ont top, filtering by Data Source, Domain
and/or Project is allowed by using the top left corner widget.
Files
To use this dashboard with your own GrimoireLab deployment you need to:
- Check
all_enrichedindex is available on your GrimoireLab instance (grimoirelab-sirmordred automatically creates this alias for you). - Import the following JSON files using Kidash tool.
| Index Pattern | —– | Dashboard |
Command line instructions
Once you have the data in place, if you need to manually upload the dashboard execute the following commands:
kidash -e https://user:pass@localhost:443/data --import all_enriched-index-pattern.json
kidash -e https://user:pass@localhost:443/data --import organizational_diversity_by_domains.json

Edit this doc