Overview
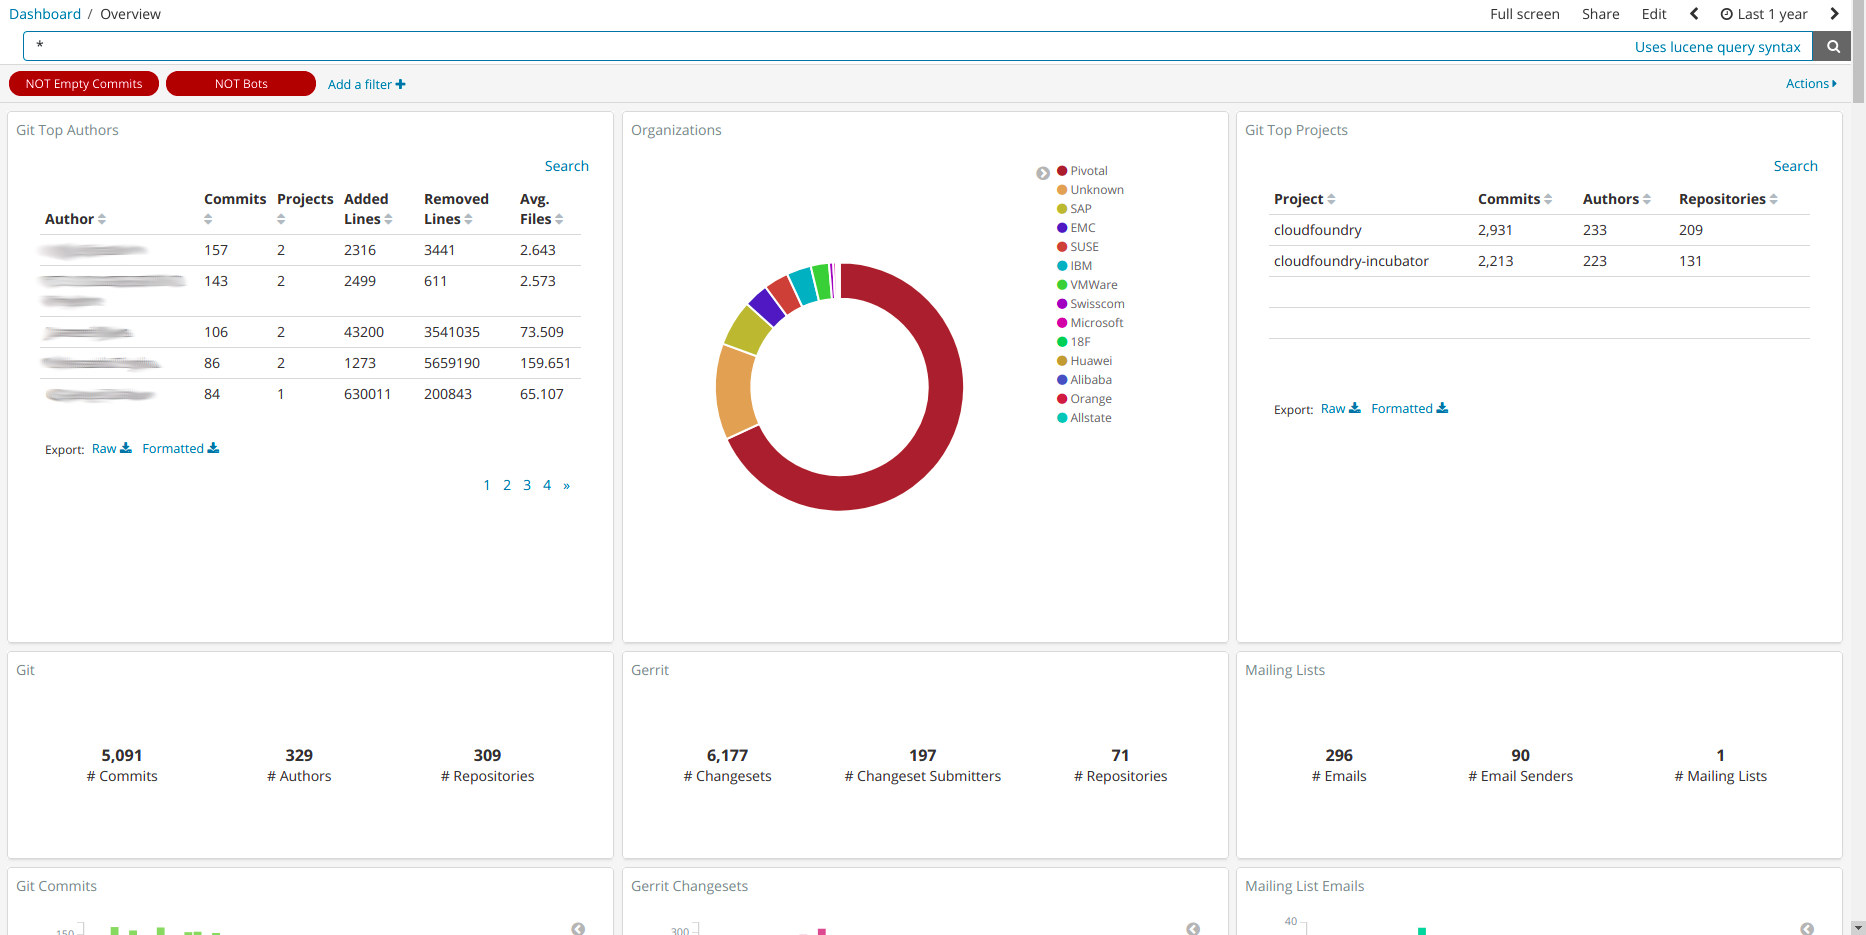
The Overview panel shows a summary of the repositories analyzed. Most of the visualizations found in it can be explored in more detail in the panels corresponding to the different analysis: Git, GitHub Issues, GitHub Issues Timing, GitHub Pull Requests, GitHub Pull Requests Timing and others.
Files
This is a special dashboard that contains visualizations for all the different data sources available in GrimoireLab. Grimoirelab-sirmordred uploads it by default and removes all the visualizations corresponding to the data sources that aren’t active.
In case you want to upload it manually, you’ll need to remove those visualizations afterwards.
Just Import the following JSON file using Kidash tool and make sure the index patterns for the data sources you are interested in are in place on Kibana.
| Dashboard |
Command line instructions
Once you have the data in place, if you need to manually upload the dashboard execute the following commands:
kidash -e https://user:pass@localhost:443/data --import overview.json
Edit this doc