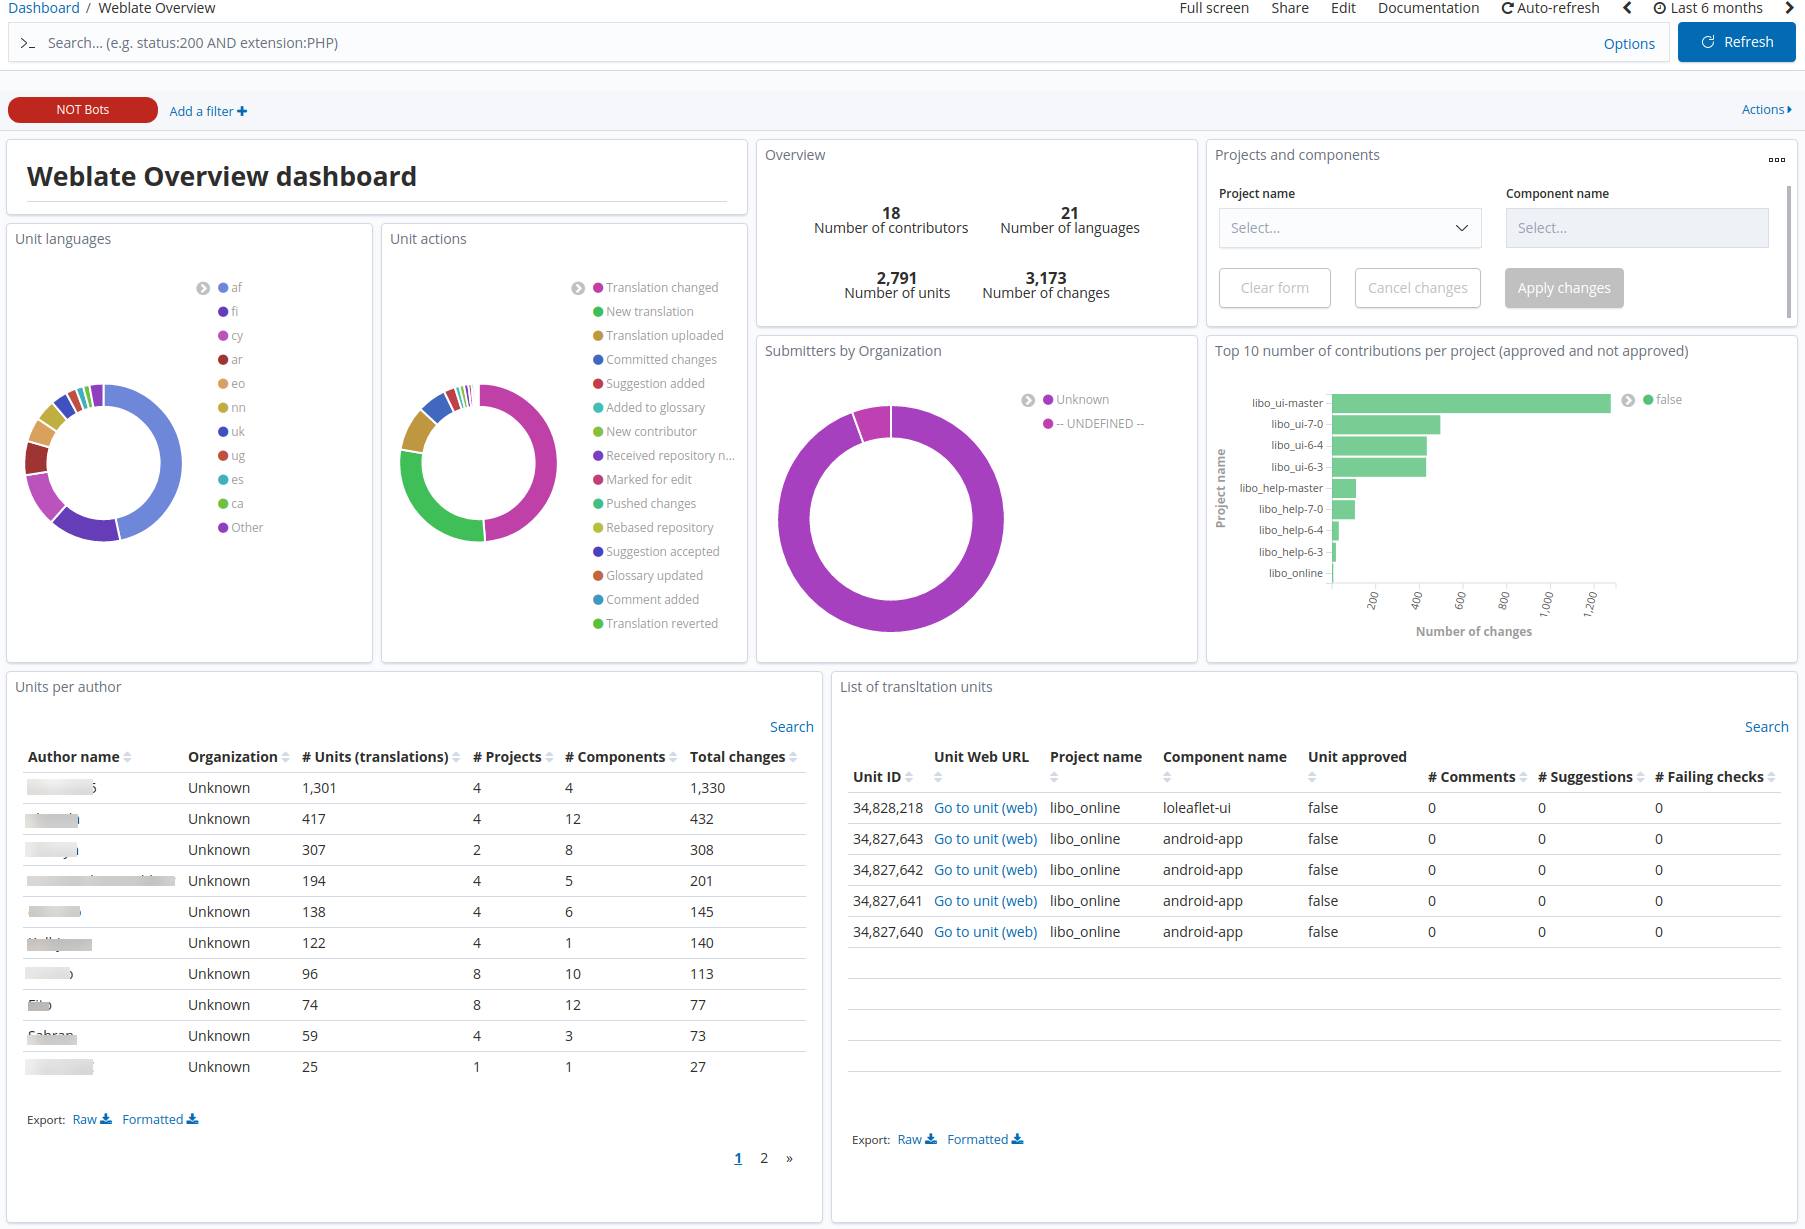
Weblate Overview
The Overview panel shows a summary of the Weblate information related
to contributors and translation units, with the possibility of filtering
by projects and their components.
Most of the visualizations found in it can be explored in more detail in
the panels corresponding to the different analysis: Unit actions and languages,
number of contributions per project, units per author and a list of units.
To avoid translation units to be counted more than once, the visualizations
use the field unit_id, instead of the unit URL.
Metrics
From left to right and top to bottom, the metrics provided are:
- Unit languages: pie chart showing the different unit languages.
- Unit actions: pie chart with the different unit actions.
- Overview: total numbers of contributors, languages and translations (units).
- Projects and components: selector to filter by projects and components.
- Submitters by Organization: a pie chart that highlights the number of submitters performing changes grouped by organizations.
- Top 10 number of contributions per project: horizontal bar chart with the amount of contributions per project, split by the contributions are approved or not.
- Units per author: table with stats with the number of units, projects, components and changes per author.
- List of translations units: table with stats for the different units, such as the project and component they belong to, and the number of comments, suggestions and failing checks.
Files
To use this dashboard with your own GrimoireLab deployment you need to:
- Check
weblateindex is available on your GrimoireLab instance (see grimoirelab-sirmordred documentation for details on how to deploy it). - Import the following JSON files using Kidash tool.
| Index Pattern | —– | Dashboard |
Command line instructions
Once you have the data in place, if you need to manually upload the dashboard execute the following commands:
kidash -e https://user:pass@localhost:443/data --import weblate-index-pattern.json
kidash -e https://user:pass@localhost:443/data --import weblate_overview.json
Edit this doc