![]()
GrimoireLab is a CHAOSS toolset for software development analytics. It includes a coordinated set of tools to retrieve data from systems used to support software development (repositories), store it in databases, enrich it by computing relevant metrics and making it easy to run analytics and visualizations on it.
Quick overview
GrimoireLab is a set of tools to retrieve, organize, analyze and visualize data coming from software development repositories. GrimoireLab tools can be used in very simple cases, such as counting authors in a git repository, or very complex ones, such as producing real time dashboards visualizing what is happening in large projects with thousands of repositories of tens of different kinds. Some of the GrimoireLab tools can be used by themselves, but usually you get the most benefit of them when you use them together. Those tools also offer several APIs, data formats, and data collections that will help you to build different kinds of processing chains for data related to software development.
For GrimoireLab, any system that stores data relevant for analyzing software development is a software development repository. GrimoireLab supports many of them, from data retrieval to analytics and visualization: git, GitHub, Bugzilla, Gerrit, Launchpad, Jira, mailing lists, Confluence, Discourse, Slack, Jenkins, Meetup, Mediawiki, Phabricator, Redmine, StackOverflow, Telegram, and others.
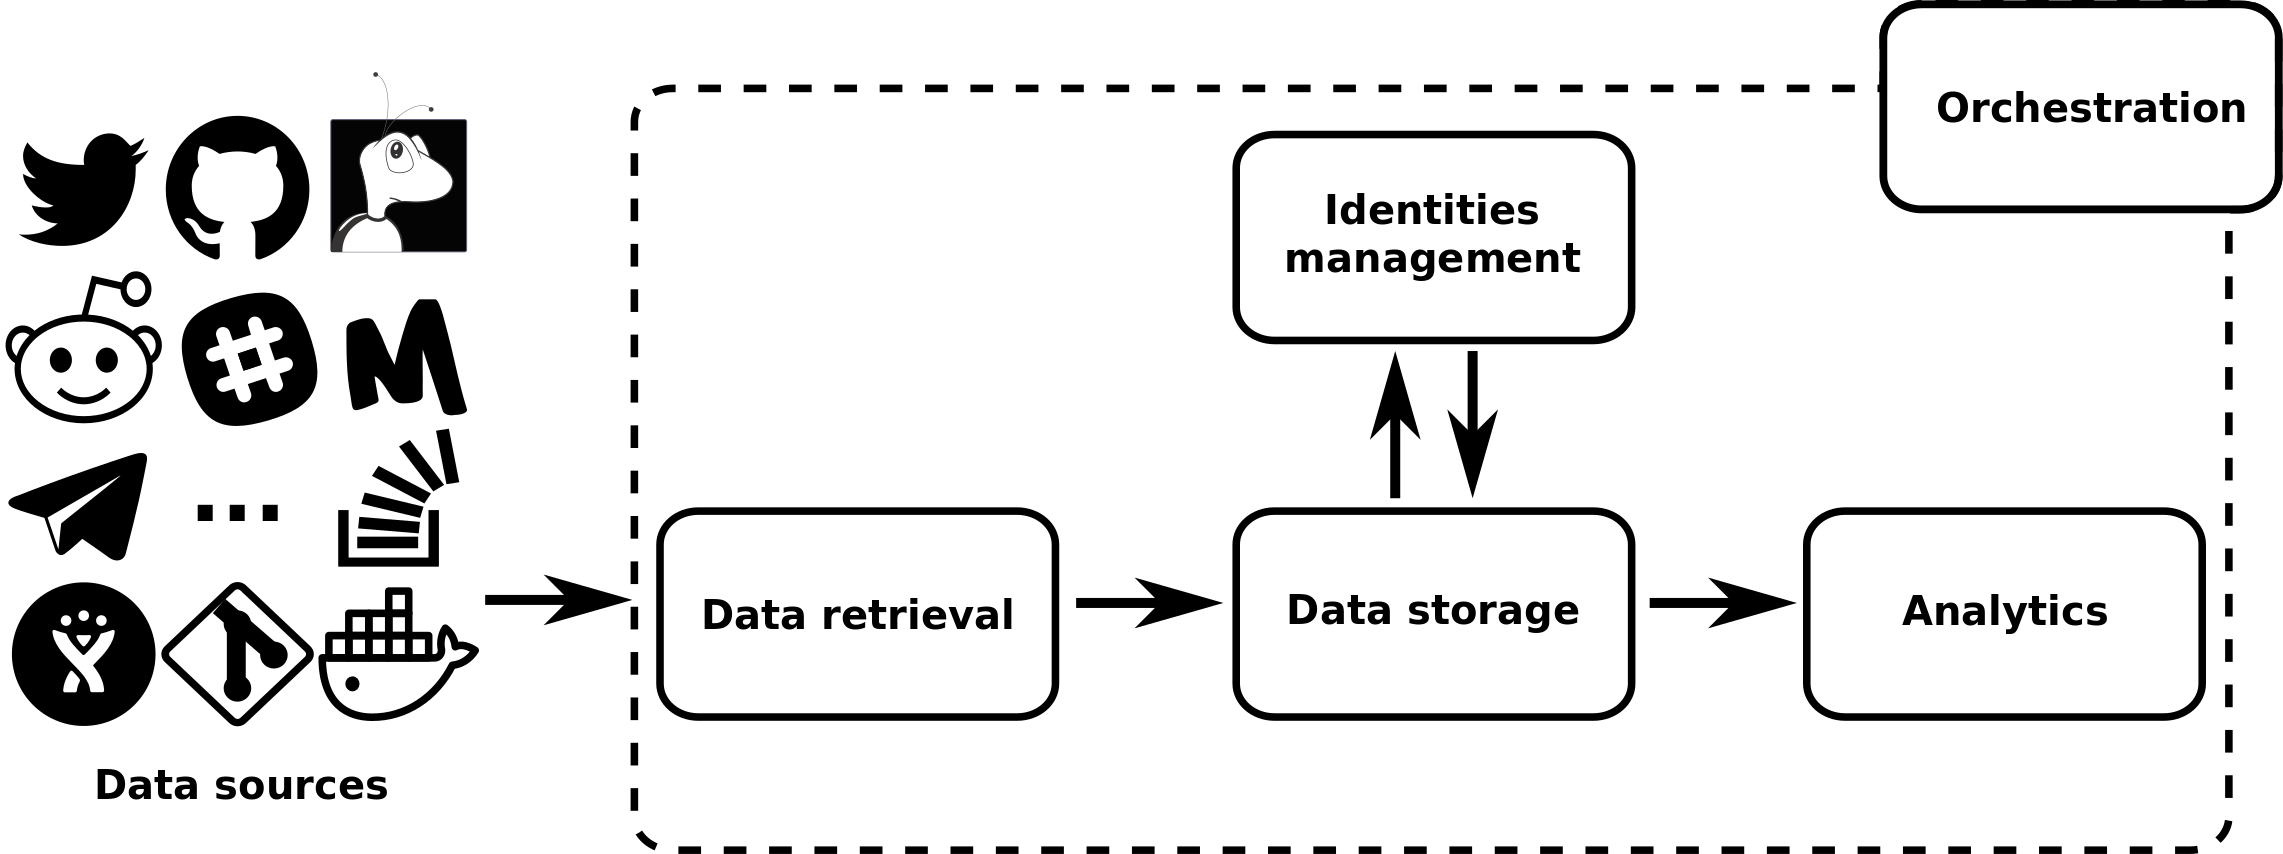
Let´s now visit the main functionalities provided by GrimoireLab. The section Workflow shows how the different components in GrimoireLab are combined to provide these functionalities.
Data retrieval
The first step to work with that data is retrieving it. GrimoireLab provides a common Python API for retrieving data from all those repositories, based on Python generators. This API allows Python code to access all the items retrieved from repositories as dictionaries (JSON documents), with simple code similar to:
github_repo = GitHub(owner=owner, repository=repo, api_token=args.token)
for item in github_repo.fetch():
    print(item['data']['number'], ':', item['data']['state'])
which will print the number and state (open or closed) of all issues and pull requests in a GitHub repository.
There are two GrimoireLab components involved in data retrieval:
- Perceval provides the common API for the many different kinds of repositories. It is a Python library that can be used standalone, from your own code, or in combination with other GrimoireLab components, to store data so that it can be analyzed later. Perceval also knows how to negotiate with the repositories APIs to perform incremental retrieval. That allows for continuous updates of recent data from the repository, retrieving only the increment, in a way that is transparent to the library user.
Data storage
In some cases, retrieved data can be analyzed directly. Usually it is much more convenient to store it in a database, so that analysis can be done conveniently on the stored data. This allows for repeated analyses without needing new data retrievals.
GrimoireLab data is stored in Elasticsearch non-SQL database indexes. Two kinds of indexes can be produced:
-
Raw indexes, in which each item corresponds to one item produced by the Perceval API, stored as a JSON document with some metadata.
-
Enriched indexes, in which each item corresponds to some abstraction useful for the kind of analytics or visualization to be done. In many cases, each item in an enriched index corresponds to an item in a raw index: for example, items in the basic git enriched index correspond to commits, as they do in the git raw index. In this case, they usually include a summary or more elaborated data.
Raw indexes aim at including all information in the original repositories. This means that any analysis on the original repositories could be done on them. Therefore, dumps of these indexes can be produced to make any analysis reproducible, or just to conveniently share the information in the original repositories in order to perform the analytics elsewhere.
Enriched indexes are usually produced with some objective in mind. In the case of GrimoireLab, it is usually some kind of visualization of the data. Current enriched indexes are usually designed for Kibiter / Kibana, the dashboarding system used by default. But they can also be used for analytics since they include a good summary of the data relevant for many studies.
The GrimoireLab component producing these indexes is Elk, which can work on data produced directly by Perceval, or consume Arthur queues.
Identities and personal metadata
When persons are relevant for the analysis to perform, it is important to merge the many different identities that the same person may use. It is also convenient to track identities for the same person in different kinds of repositories, and to annotate those merged identities with metadata. For example, metadata can be affiliation information (for which organization that person works), or whether it is a real person or a bot.
SortingHat is the GrimoireLab component for managing identities and their metadata. It uses a relational database to track all identities found in the repositories, and can use several heuristics and data sources to merge identities and annotate them. For example, it can consume gitdm files with affiliation and merged identities, or its own format to export / import this kind of information.
In the usual pipeline, ELK interacts with SortingHat to feed it with all identities found in raw indexes. Later, when producing enriched indexes, it includes the merged identities, affiliation, bot status, etc. produced by SortingHat.
This way, an analysis performed on enriched indexes with the right information coming from SortingHat allows for a correct count of developers and other actors in software development.
Visualization and analytics
Enriched indexes in GrimoireLab are designed to be visualized and analyzed. They can in principle be fed to any tool that can link to ElasticSearch indexes, and of course custom code can also be produced for the analysis. But GrimoireLab already provides some components to simplify this task:
-
Kibiter, a soft fork of Kibana, or Kibana itself, can be used to visualize data in actionable dashboards. Kibana is the standard dashboarding system for ElasticSearch, and Kibiter offers some small, but useful, added functionality for it. Both can be used directly with enriched indexes. Building visualizations and dashboards with them is easy.
-
Sigils is a set of visualizations and dashboards that can be used to produce default dashboards for the enriched indexes. They are loaded in Kibiter or Kibana with Kidash, also a GrimoireLab tool, and provide the means for actionable inspection, drill down, and filtering of many facets of the data in the analyzed repositories.
-
Manuscripts is a tool to produce summary tables and documents with analytics about enriched indexes. The tables are available in CSV format so they can be imported into spreadsheets or other programs. Documents can be produced as PDF files, ready to be delivered to decision makers, showing relevant aspects of the analyzed project.