How to filter data
There are two places in GrimoireLab where we can change and add filters.
- Time Picker
- Normal Filters
Time Picker
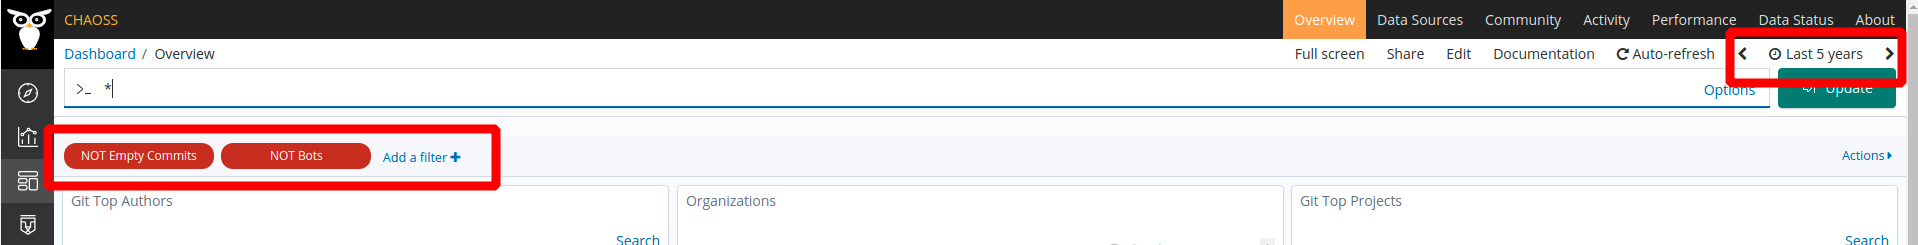
Most dashboards are based on item creation date. So you can filter according to a time frame. Time Picker allows you to visualize data according to a particular time frame.
You can also set a custom time picker if needed. Go to the section Time picker
quick ranges in Management -> Advances Settings and add your quickRanges to
the list. An example of quickRange is provided below. from and to contain
date values, display is the title thay will be displayed in kibiter and
section defines the column where the quickRange will be added.
Note: You need to be logged in to save your custom time picker. Check the private and public access section to understand about permissions in GrimoireLab dashboards.
{
  "from": "2020-03-21 00:00:00",
  "to": "2020-04-24 00:00:00",
  "display": "Most active period",
  "section": 3
}
You can also set a custom time picker without actually looking into settings.
- Click on Time Picker and choose “Absolute”.
- Set your time frame and press on “Go” to apply the filter.
Normal Filters
You can set a filter by clicking on Add filter. This filter allows you to set a particular key-value pair and display the visualizations according to that value. You can even set the operators to check for that particular value orevery other data except the one mentioned.
Steps
-
Click on “Add filter” on top of your panels.
-
A popover will appear. Choose your field, the operator and the filtering value.
-
Once you’ve set your values, save it and the visualizations should re-ajust to fit your filter.